
1960 Atlantic hurricane season
| 1960 Atlantic hurricane season | |
|---|---|
 Season summary map | |
| Seasonal boundaries | |
| First system formed | June 22, 1960 |
| Last system dissipated | September 26, 1960 |
| Strongest storm | |
| Name | Donna |
| • Maximum winds | 145 mph (230 km/h) (1-minute sustained) |
| • Lowest pressure | 930 mbar (hPa; 27.46 inHg) |
| Seasonal statistics | |
| Total depressions | 8 |
| Total storms | 8 |
| Hurricanes | 4 |
| Major hurricanes (Cat. 3+) | 2 |
| Total fatalities | 454 |
| Total damage | $990.74 million (1960 USD) |
| Related articles | |
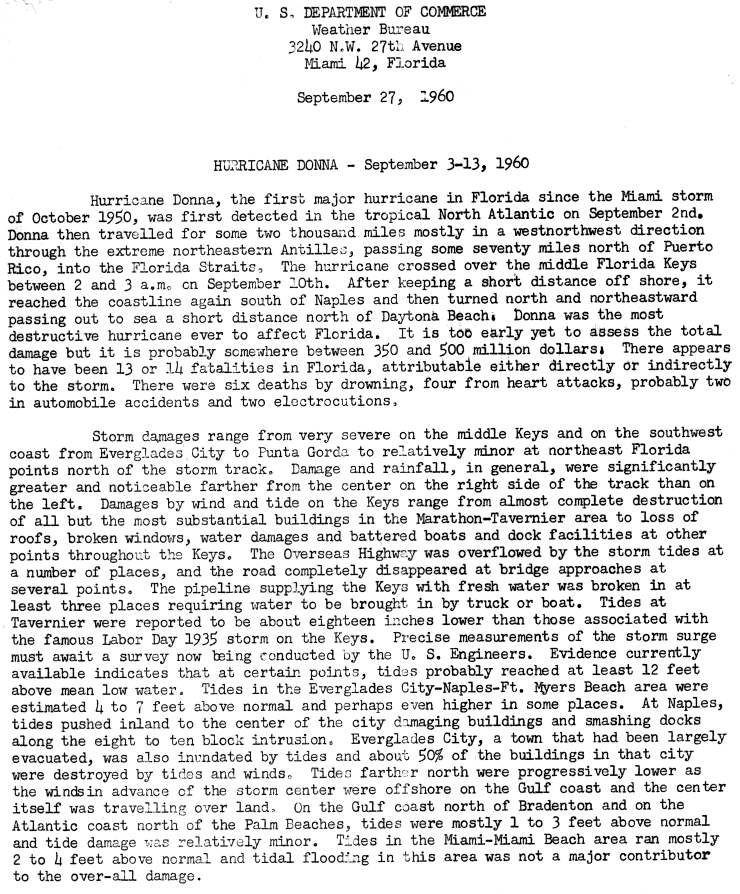
The 1960 Atlantic hurricane season was the least active season since 1952. The season officially began on June 15,[1] and lasted until November 15.[2] These dates conventionally delimit the period of each year when most tropical cyclones form in the Atlantic basin. The first system, an unnamed storm, developed in the Bay of Campeche on June 22. It brought severe local flooding to southeastern Texas and was considered the worst disaster in some towns since a Hurricane in 1945. The unnamed storm moved across the United States for almost a week before dissipating on June 29. In July, Hurricane Abby resulted in minor damage in the Leeward Islands, before impacting a few Central American counties — the remnants of the storm would go on to form Hurricane Celeste in the East Pacific. Later that month, Tropical Storm Brenda caused flooding across much of the East Coast of the United States. The next storm, Hurricane Cleo, caused no known impact, despite its close proximity to land.
The most significant storm of the season was Hurricane Donna, which at the time was among the ten costliest United States hurricanes. After the precursor caused a deadly plane crash in Senegal, the storm itself brought severe flooding and wind impacts to the Lesser Antilles and Florida, where Donna made landfall as a Category 4 hurricane. It moved northeast and struck North Carolina and Long Island, New York, while still at hurricane intensity. Donna caused at least 428 fatalities and $980 million (1960 USD) in damage. Hurricane Ethel reached Category 3 intensity, but rapidly weakened before making landfall in Mississippi, resulting in only 1 fatality and $1.5 million in losses. The final storm, Florence, developed on September 17. It remained weakened and moved erratically over Cuba and Florida. Only minor flooding was reported. Collectively, the tropical cyclones in 1960 caused at least 454 deaths and about $990.74 million in damage.
Season summary[edit]


The Atlantic hurricane season officially began on June 15, 1960.[1] It was a below-average season in which seven tropical depressions formed. All seven of the depressions attained tropical storm status, which was below the 1950–2000 average of 9.6 named storms. Four of these reached hurricane status, also falling short of the 1950–2000 average of 5.9. Furthermore, two storms reached major hurricane status, which is Category 3 or higher on the Saffir–Simpson hurricane wind scale. Two hurricane and four tropical storms made landfall during the season and caused 454 deaths and $410.74 million (1960 USD) in damage.[3]
Season activity began on June 23, with the development of an unnamed tropical storm. Tropical cyclogenesis resumed in July with Hurricane Abby between July 10 and July 16, followed by Tropical Storm Brenda from July 28 to July 31. In mid-August, Hurricane Cleo developed and had an uneventful duration. At the end of that month, Hurricane Donna formed and lasted into mid-September; it was the strongest tropical cyclone of the season, peaking as a Category 4 hurricane. There was a Category 3 hurricane in September, Ethel, which briefly existed in the Gulf of Mexico. The last storm of the season, Tropical Storm Florence, dissipated on September 25, over a month before the official end of the season on November 15.[2][4]
The season's activity was reflected with an accumulated cyclone energy (ACE) rating of 73 units, the lowest value since 1956. ACE is, broadly speaking, a measure of the power of the hurricane multiplied by the length of time it existed, so storms that last a long time, as well as particularly strong hurricanes, have high ACEs. It is only calculated for full advisories on tropical systems at or exceeding 39 mph (63 km/h) or tropical storm strength.[5]
Systems[edit]
June tropical storm[edit]
| Tropical storm (SSHWS) | |
.jpg)  | |
| Duration | June 22 – June 28 |
|---|---|
| Peak intensity | 60 mph (95 km/h) (1-min); ≤1000 mbar (hPa) |
Observations from a reconnaissance flight on June 22 indicated that a large area of showers and thunderstorms in the Gulf of Mexico was producing winds up to 40 mph (64 km/h). Because no circulation was reported, it was operationally classified as a tropical low, though radar stations along the Gulf Coast of Mexico indicated a circulation. Thus, the system became a tropical depression at 0600 UTC on June 22, while located in the Bay of Campeche. The depression strengthened and was estimated to have become a tropical storm on June 23. By early on the following day, the storm peaked with winds of 45 mph (72 km/h). Later that day, it made landfall near Corpus Christi, Texas at the same intensity. The storm weakened slowly and moved across the Central United States, before dissipating over Illinois on June 28.[4][6]
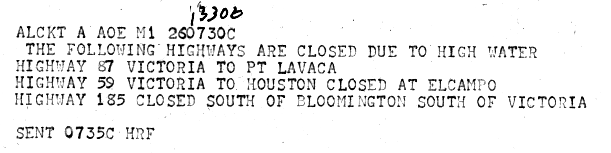
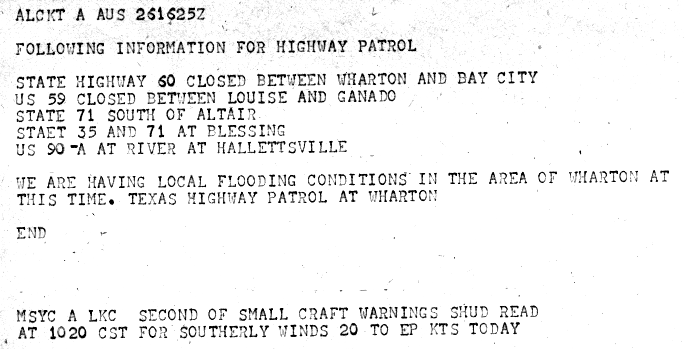
In Texas, the storm dropped up to 29.76 inches (756 mm) of precipitation in Port Lavaca.[7] Thus considerable flooding occurred in some areas of south and eastern Texas. Throughout the state, more than 150 houses sustained flood damage in several counties. In addition, numerous major highways were closed, including portions of U.S. Routes 59, 87, 90, and 185, and Texas State Highways 35 and 71.[8][9] In Arkansas, a few buildings in Hot Springs were damaged from high winds. Elsewhere, light to moderate rainfall was recorded in at least 11 other states, though damage was minimal.[7] The storm was the wettest tropical cyclone on record in the state of Kentucky, dropping 11.25 inches (286 mm) in Dunmor.[10] Overall, the storm was attributed to 15 fatalities and $3.6 million in damage.[4]
Hurricane Abby[edit]
| Category 1 hurricane (SSHWS) | |
  | |
| Duration | July 9 – July 17 |
|---|---|
| Peak intensity | 80 mph (130 km/h) (1-min); 995 mbar (hPa) |
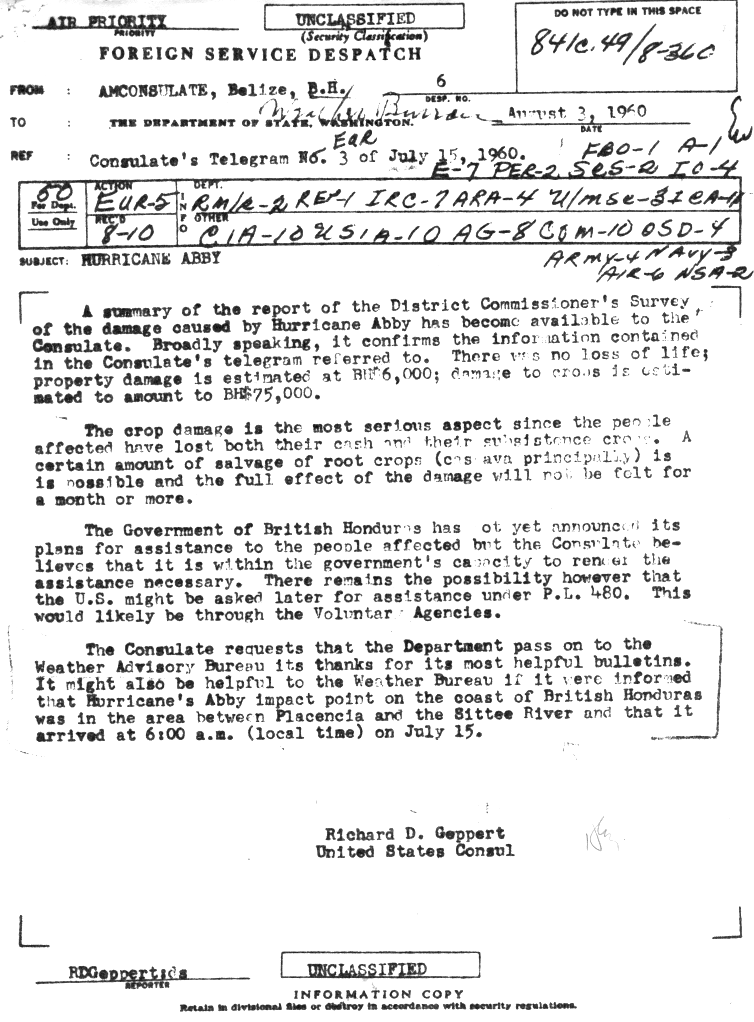
A tropical wave developed into a tropical depression near the Windward Islands on July 10. That day, the depression intensified into Tropical Storm Abby, striking Saint Lucia with winds of 65 mph (105 km/h). Abby tracked westward across the Caribbean Sea with little change in intensity. The storm brushed the northern coast of Honduras before intensifying into a hurricane on July 15, striking the offshore Roatán island with peak winds of 80 mph (130 km/h). Later that day, Hurricane Abby made landfall in southern British Honduras (present day Belize). Abby quickly weakened inland, moving across Guatemala and coastal Mexico. On July 17, Abby dissipated over the Mexican state of Veracruz.[6] However, the remnants later redeveloped into Hurricane Celeste in the eastern Pacific.[4]
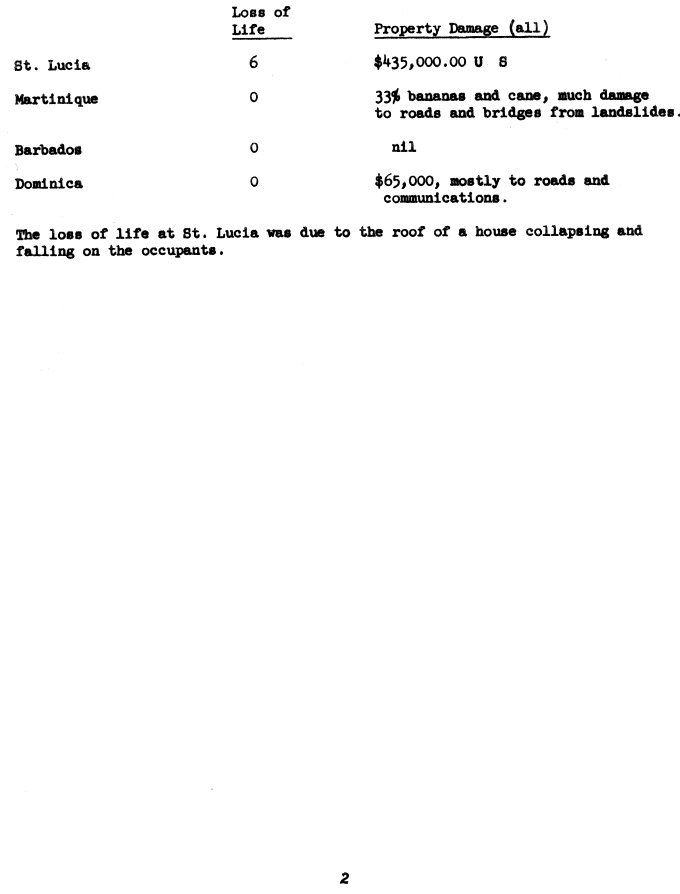
Abby produced tropical storm force winds and up to 6.8 inches (170 mm) of precipitation in St. Lucia. Six people died when a roof of a house collapsed. Damage in St. Lucia reached $435,000, most of which was incurred to banana and coconut crops. In Martinique, wind gusts of 75 mph (121 km/h) and about 4 inches (100 mm) of rain damaged 33% of banana and sugar cane crops. The resultant landslides from the precipitation extensively impacted roads and bridges.[4] In Dominica, light winds and precipitation up to 5.91 inches (150 mm) with damages reaching $65,000, entirely to roads and communications.[11] Offshore islands of Honduras reported winds up to 52 mph (84 km/h) and light rainfall.[12] Damage in British Honduras was light, with about $40,500 in losses, mostly to agriculture.[13]
Tropical Storm Brenda[edit]
| Tropical storm (SSHWS) | |
  | |
| Duration | July 27 – July 31 |
|---|---|
| Peak intensity | 70 mph (110 km/h) (1-min); 991 mbar (hPa) |
A weak low-pressure area in the Gulf of Mexico developed on July 26, organizing into Tropical Storm Brenda a day later. The minimal tropical storm moved ashore near Cross City, Florida on July 29, and moved northeastward along the east coast of the United States, gradually intensifying despite being largely over land. Later that day, the storm briefly moved offshore before striking southern North Carolina with peak winds of 70 mph (110 km/h). After moving through the Mid-Atlantic states and New England, Brenda transitioned into an extratropical cyclone on July 31 over Maine. The remnants of Brenda interacted with another extratropical storm over eastern Canada before absorbing it. For about a week, the remnants of Brenda drifted and executed a large loop over northern Quebec, Labrador, and adjacent waters, eventually dissipating on August 7.[6]
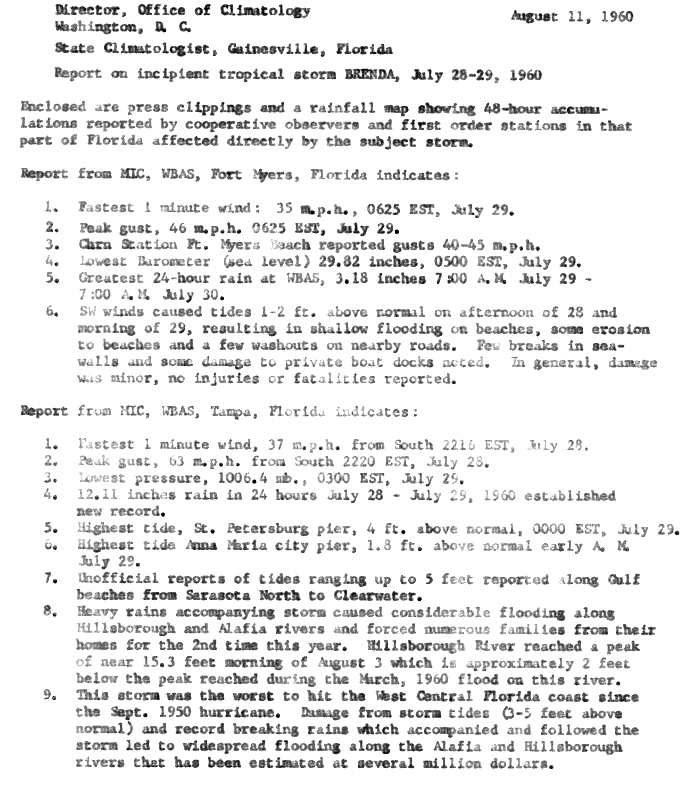
Brenda was considered the worst storm to strike West Central Florida since Hurricane Easy in 1950.[14] It brought wind gusts up to 60 mph (97 km/h) and rainfall amounts reaching 14.57 inches (370 mm) at the Tampa International Airport. While no casualties are directly blamed on the storm, at least one traffic-related death took place.[4] According to an American Red Cross Disaster Service report encompassing eight Florida counties, 11 houses sustained significant damage, while 567 suffered more minor damage. Around 590 families were affected overall. Total monetary damage in Florida is placed at nearly $5 million.[14] Further north, other states reported strong winds and locally heavy rainfall,[15] though no significant damage occurred.[4]
Hurricane Cleo[edit]
| Category 1 hurricane (SSHWS) | |
 | |
| Duration | August 17 – August 21 |
|---|---|
| Peak intensity | 85 mph (140 km/h) (1-min); 995 mbar (hPa) |
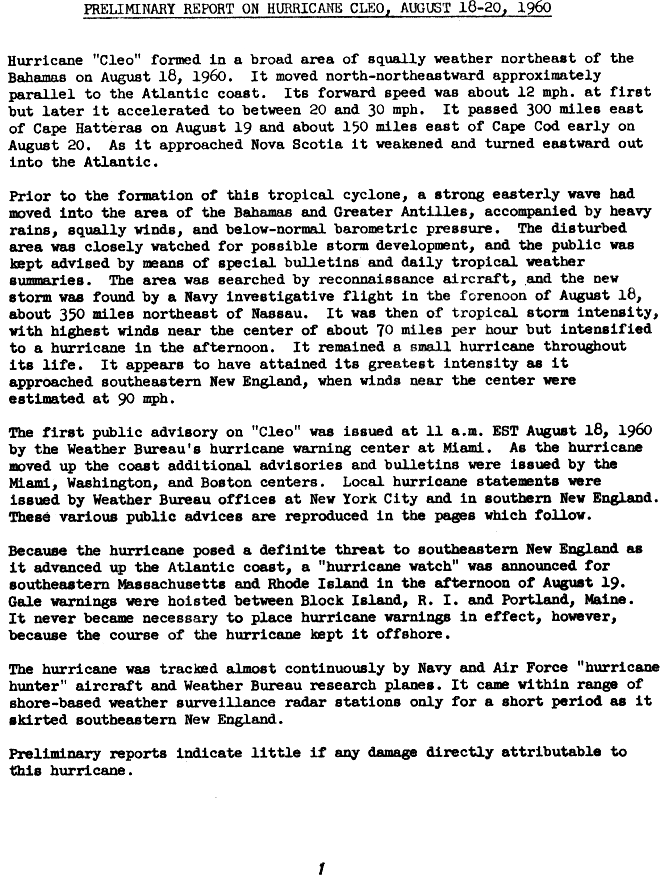
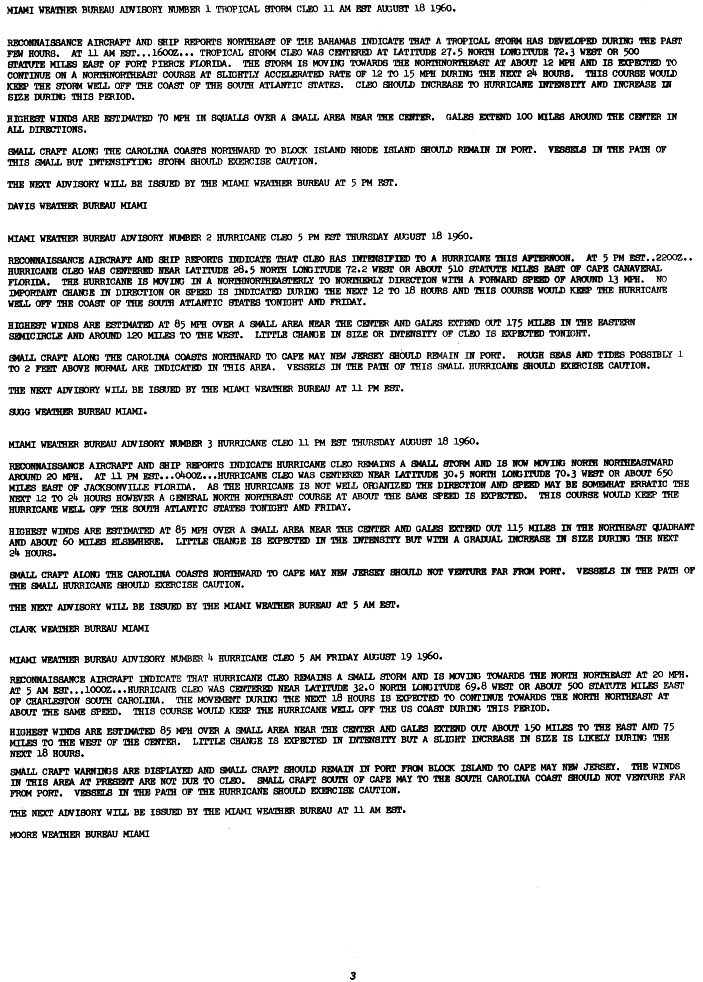
A strong tropical wave produced rainfall and gusty winds in The Bahamas and the Greater Antilles in mid-August. The wave was closely monitored for possible tropical cyclogenesis and special bulletins were issued by the United States Weather Bureau.[16] At 1800 UTC on August 17, Tropical Storm Cleo developed near Cat Island in The Bahamas. The storm headed northeastward and immediately began to intensify.[17] Operationally, the United States Weather Bureau at the hurricane warning center in Miami did not initiate advisories on Cleo until 1500 UTC on August 18. Sustained winds were already 70 mph (110 km/h) at the time, as recorded by a reconnaissance aircraft flight.[18] By 1800 UTC on August 18, Cleo strengthened into a hurricane.[17]
Throughout its duration, Cleo remained a relatively small tropical cyclone. Because the storm posed a significant threat to New England, a "hurricane watch" was issued for southeastern Massachusetts and Rhode Island on August 19. Various gale warnings were also put into effect from Block Island, Rhode Island, to Portland, Maine. However, this was unnecessary because Cleo remained well offshore.[18] On August 19, Cleo peaked with winds of 85 mph (137 km/h), but it weakened to a tropical storm the next day. Cleo curved east-northeastward on August 20, remaining south of Nova Scotia, until it dissipated a day later.[17]
Hurricane Donna[edit]
| Category 4 hurricane (SSHWS) | |
  | |
| Duration | August 29 – September 13 |
|---|---|
| Peak intensity | 145 mph (230 km/h) (1-min); 930 mbar (hPa) |
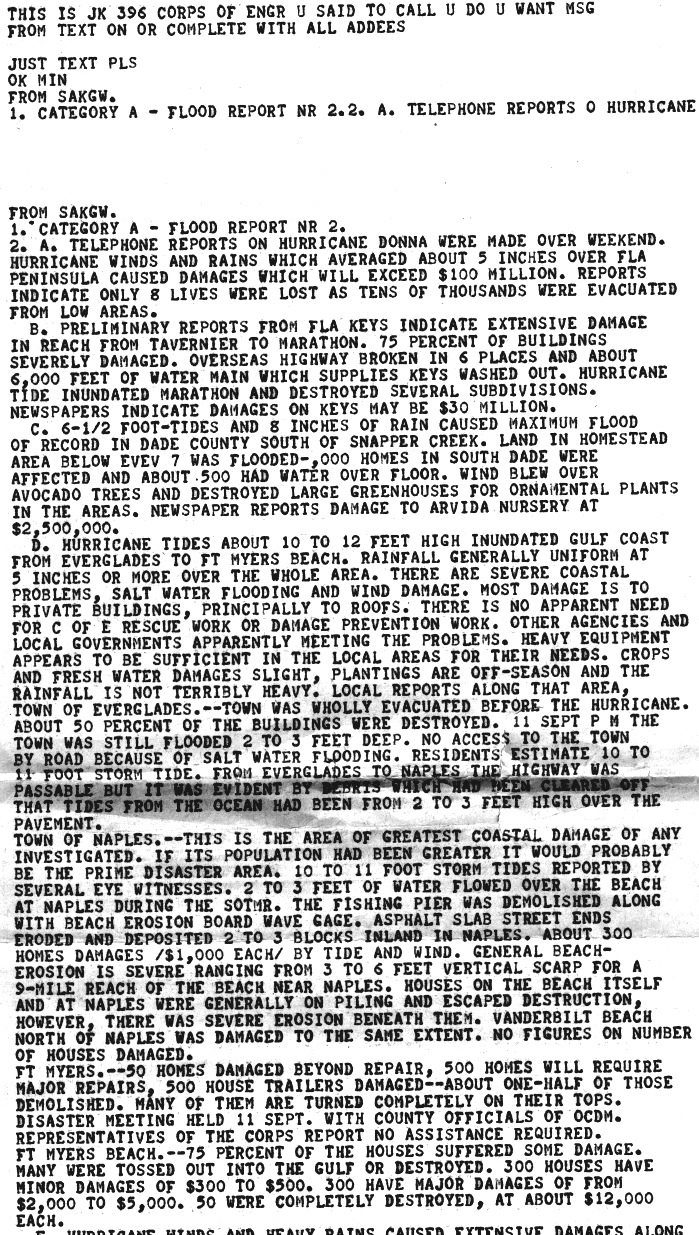
A tropical wave in west Africa, blamed for 63 deaths in a plane crash in Senegal,[19] developed into a tropical depression south of Cape Verde late on August 29. The depression strengthened into Tropical Storm Donna by the following day. Donna moved west-northwestward at roughly 20 mph (32 km/h) and by August 31, it reached hurricane status. Significant deepening occurred during the next 30 hours, with Donna being a moderate Category 4 hurricane by late on September 2. Thereafter, it weakened some and brushed the Lesser Antilles later that day.[17] On Saint Maarten, the storm left a quarter of the island homeless and killed 7 people. An additional 5 deaths were reported in Anguilla and there were 7 other deaths throughout the Virgin Islands. In Puerto Rico, severe flash flooding led to 107 fatalities, 85 of them in Humacao alone.[4] Donna further weakened to a Category 3 hurricane late on September 5, but eventually became a Category 4 hurricane again.[17] While passing through The Bahamas, several small island communities in the central regions of the country were leveled, but no damage total or fatalities were reported.[4]
Early on September 10, Donna made landfall near Marathon, Florida on Vaca Key with winds of 140 mph (230 km/h), hours before another landfall between Fort Myers and Naples at the same intensity.[17] Florida bore the brunt of Hurricane Donna. In the Florida Keys, coastal flooding severely damaged 75% of buildings, destroyed several subdivisions in Marathon. On the mainland, 5,200 houses were impacted, which does not include the 75% of homes damaged at Fort Myers Beach; 50% of buildings were also destroyed in the city of Everglades.[20] Crop losses were also extensive. A total of 50% of grapefruit crop was lost, 10% of the orange and tangerine crop was lost, and the avocado crop was almost completely destroyed.[21] In the state of Florida alone, there were 13 deaths and $300 million in losses.[4] Donna weakened over Florida and was a Category 2 hurricane when it re-emerged into the Atlantic from North Florida. By early on September 12, the storm made landfall near Topsail Beach, North Carolina with winds of 110 mph (180 km/h).[17] Donna brought tornadoes and wind gusts as high as 100 mph (160 km/h), damaging or destroying several buildings in Eastern North Carolina, while crops were impacted as far as 50 miles (80 km) inland. Additionally, storm surge caused significant beach erosion and structural damage Wilmington and Nags Head. There were 8 deaths and over 100 injuries.[22] Later on September 12, Donna reemerged into the Atlantic Ocean and continued to move northeastward. The storm struck Long Island, New York late on September 12 and rapidly weakened inland. On the following day, Donna became extratropical over Maine.[17]
September tropical storm[edit]
| Tropical storm (SSHWS) | |
  | |
| Duration | September 1 – September 3 |
|---|---|
| Peak intensity | 45 mph (75 km/h) (1-min); 1009 mbar (hPa) |
For several days, a weak low pressure area moved across the tropical Atlantic, which organized into a tropical storm on September 1 to the northeast of the Lesser Antilles. That day, peak winds were estimated at 45 mph (72 km/h), based on reports from ships and the Hurricane Hunters. The storm moved northward and weakened. On September 3, the system was absorbed by an approaching cold front. The storm was added to the Atlantic hurricane database in 2016.[6]
Hurricane Ethel[edit]
| Category 3 hurricane (SSHWS) | |
  | |
| Duration | September 12 – September 17 |
|---|---|
| Peak intensity | 115 mph (185 km/h) (1-min); 974 mbar (hPa) |
A trough was located over the Gulf of Mexico on September 8, which interacted with a weakening cold front to produce a low pressure area, and eventually a tropical depression on September 12. On the next day, the system intensified into Tropical Storm Ethel, which began a period of rapid intensification a day later. By late on September 14, Ethel reached peak winds of 115 mph (185 km), presenting a well-defined eye. Operationally, the Hurricane Hunters estimated winds of 160 mph (260 km/h), making Ethel a Category 5 hurricane, although a reanalysis in 2016 downgraded Ethel to a Category 3. Cooler air caused a period of rapid weakening, and Ethel moved ashore near Pascagoula, Mississippi with sustained winds of 80 mph (130 km/h). The storm gradually weakened after moving inland, before eventually dissipating over southern Kentucky on September 17.[6][17]
In Louisiana, the outer bands of the storm produced light rainfall and hurricane-force winds, though no damage was reported in that state.[23] Offshore Mississippi, rough seas inundated Horn Island and split Ship Island.[24] Tropical storm force winds in the southern portion of the state littered broken glass, trees, and signs across streets in Pascagoula, as well as down power lines, which caused some residents to lose power.[25] In Alabama, winds damaged beach cottages along the Gulf Coast, and damaged crops in the southern portion of the state.[22] Although large amounts of rain fell in the extreme western portions of Florida, peaking at 12.94 inches (329 mm) in Milton, no significant flooding occurred in Florida.[26] A lightning strike to a power station near Tallahassee caused a brief citywide blackout.[27] The storm spawned four tornadoes in Florida,[22] one of which destroyed 25 homes.[28] Outside the Gulf Coast of the United States, rain fell in eight others states, but no damage is known to have occurred.[26] Overall, Ethel caused one fatality and $1.5 million in losses.[4][22][29]
Tropical Storm Florence[edit]
| Tropical storm (SSHWS) | |
  | |
| Duration | September 17 – September 26 |
|---|---|
| Peak intensity | 60 mph (95 km/h) (1-min); ≤1000 mbar (hPa) |
A westward moving tropical wave developed into a tropical depression while located north of Puerto Rico on September 17. By the following day, the depression strengthened into Tropical Storm Florence. Later on September 18, Florence peaked as a 45 mph (72 km/h) tropical storm as it approached The Bahamas. However, unfavorable conditions weakened the storm back to a tropical depression on September 19. On September 21, Florence lost its surface circulation, and the disturbance executed a small cyclonic loop over Cuba. On September 23, the system redeveloped its surface center, and it became a tropical depression again, moving ashore Monroe County, Florida that day. The storm drifted northeastward across the state, re-intensifying into a tropical storm and reaching winds of 60 mph (97 km/h). The storm turned back to the west-northwest and weakened again to a tropical depression. Florence moved across the northeastern Gulf of Mexico, moving ashore again near the Alabama-Florida border on September 26, and dissipating soon after.[4][6]
On Grand Bahama, 5.48 inches (139 mm) of rain fell in only 6 hours.[30] The storm dropped rainfall across Florida, though the heavier amounts were mainly on the Atlantic coast. Precipitation peaked at 15.79 inches (401 mm) near Fellsmere, while rainfall reached 10 inches (250 mm) in some areas of the Miami metropolitan area.[31] Although Florence was a depression at landfall,[4] sustained winds between 35 and 40 mph (56 and 64 km/h) were recorded in Ocean Ridge,[32] while a gust as high as 52 mph (84 km/h) was reported in Vero Beach.[4] In Jacksonville, a pressure gradient combined with Florida to produce tides of 2 to 3 feet (0.61 to 0.91 m) about normal.[30]
Storm names[edit]
The following list of names was used for named storms that formed in the North Atlantic in 1960.[33] Storms were named Abby and Donna for the first time in 1960.
|
|
Retirement[edit]
Following the season, the name Donna was retired. It was replaced with Dora for the 1964 season.[34][35]
Season effects[edit]
This is a table of all of the storms that formed in the 1960 Atlantic hurricane season. It includes their name, duration, peak classification and intensities, areas affected, damage, and death totals. Deaths in parentheses are additional and indirect (an example of an indirect death would be a traffic accident), but were still related to that storm. Damage and deaths include totals while the storm was extratropical, a wave, or a low, and all of the damage figures are in 1960 USD.
| Saffir–Simpson scale | ||||||
| TD | TS | C1 | C2 | C3 | C4 | C5 |
| Storm name |
Dates active | Storm category at peak intensity |
Max 1-min wind mph (km/h) |
Min. press. (mbar) |
Areas affected | Damage (USD) |
Deaths | Ref(s) | ||
|---|---|---|---|---|---|---|---|---|---|---|
| Unnamed | June 22 – 28 | Tropical storm | 60 (95) | 1000 | Mexico, Texas, Oklahoma, Arkansas, Missouri, Illinois | $3.6 million | 18 | [4][36] | ||
| Abby | July 9 – 17 | Category 1 hurricane | 80 (130) | 995 | Lesser Antilles, Greater Antilles, Central America | $640,000 | 6 | [4][13] | ||
| Brenda | July 27 – 31 | Tropical storm | 70 (110) | 991 | East Coast of the United States, Eastern Canada | $5 million | 1 | [4][14] | ||
| Cleo | August 17 – 21 | Category 1 hurricane | 85 (140) | 995 | Greater Antilles, The Bahamas, Northeastern United States, Nova Scotia | Minimal | None | |||
| Donna | August 29 – September 13 | Category 4 hurricane | 145 (230) | 930 | Greater Antilles, East Coast of the United States, New England, Atlantic Canada, Greenland | $980 million | 428 | [4][19][37][38] | ||
| Unnamed | September 1 – 3 | Tropical storm | 45 (75) | 1009 | None | None | None | |||
| Ethel | September 12 – 17 | Category 3 hurricane | 115 (185) | 974 | Southern United States | $1.5 million | 1 | [4][22][29] | ||
| Florence | September 17 – 26 | Tropical storm | 60 (95) | 1000 | Greater Antilles, The Bahamas, Gulf Coast of the United States | Minimal | None | |||
| Season aggregates | ||||||||||
| 8 systems | June 22 – September 26 | 145 (230) | 930 | $990.74 million | 454 | |||||
See also[edit]
- 1960 North Indian Ocean cyclone season
- 1960 Pacific hurricane season
- 1960 Pacific typhoon season
- Australian region cyclone seasons: 1959–60 1960–61
- South Pacific cyclone seasons: 1959–60 1960–61
- South-West Indian Ocean cyclone seasons: 1959–60 1960–61
References[edit]
- ^ a b "1960 Hurricane Season Open As Planes Prowl". The Evening Independent. Associated Press. June 15, 1960. p. 1-A. Retrieved January 10, 2013.
- ^ a b "Hurricane Hunters Go Away Till The Next Time". The Miami News. November 15, 1960. p. 13A. Retrieved February 21, 2020 – via Newspapers.com.

- ^
- Gordon E. Dunn (March 1961). The Hurricane Season of 1960 (PDF). United States Weather Bureau; Atlantic Oceanographic and Meteorological Laboratory (Report). National Oceanic and Atmospheric Administration. Archived (PDF) from the original on May 25, 2011. Retrieved April 25, 2013.
- Storm Data and Unusual Weather Phenomena: June 1960 (PDF). National Climatic Data Center (Report). Asheville, North Carolina: National Oceanic and Atmospheric Administration. 1960. Archived from the original (PDF) on October 13, 2021. Retrieved October 13, 2021.
- Richard D. Geppert (August 3, 1960). Hurricane Abby. United States Weather Bureau (Report). Miami, Florida: National Hurricane Center; National Oceanic and Atmospheric Administration. Retrieved May 6, 2013.
- Keith Butson (August 11, 1960). Report on incipient tropical storm Brenda, July 28–29, 1960 (GIF). United States Weather Bureau (Report). National Hurricane Center; National Oceanic and Atmospheric Administration. Retrieved April 26, 2013.
- Late Twentieth Century. National Oceanic and Atmospheric Administration (Report). College Park, Maryland: Weather Prediction Center. March 1, 2007. Retrieved May 6, 2013.
- Edward N. Rappaport; Jose Fernandez-Partagas; Jack L. Beven (April 22, 1997). The Deadliest Atlantic Tropical Cyclones, 1492–1996. National Hurricane Center (Report). National Oceanic and Atmospheric Administration. Archived from the original on May 14, 2011. Retrieved March 6, 2012.
- 1960-Donna (Report). Environment Canada. November 5, 2009. Archived from the original on March 13, 2013. Retrieved October 13, 2021.
- Storm Data and Unusual Weather Phenomena: September 1960 (PDF). National Climatic Data Center (Report). Asheville, North Carolina: National Oceanic and Atmospheric Administration. 1960. pp. 111–115. Archived from the original (PDF) on 2013-05-09. Retrieved May 6, 2013.
- "Cleanup slowed in wake of Hurricane Ethel". The Bulletin. Bend, Oregon. United Press International. September 16, 1960. p. 6. Retrieved May 24, 2010.
- ^ a b c d e f g h i j k l m n o p q r s Gordon E. Dunn (March 1961). The Hurricane Season of 1960 (PDF). United States Weather Bureau; Atlantic Oceanographic and Meteorological Laboratory (Report). National Oceanic and Atmospheric Administration. Archived (PDF) from the original on May 25, 2011. Retrieved April 25, 2013.
- ^ Atlantic basin Comparison of Original and Revised HURDAT. Hurricane Research Division; Atlantic Oceanographic and Meteorological Laboratory (Report). National Oceanic and Atmospheric Administration. September 2021. Retrieved October 13, 2021.
- ^ a b c d e f Sandy Delgado; Chris Landsea (July 2016). Documentation of Atlantic Tropical Cyclones Changes in HURDAT (1960) (PDF) (Report). Hurricane Research Division. Retrieved 2018-08-06.
- ^ a b David M. Roth (March 12, 2007). Unnamed Tropical Storm – June 22–29, 1960 (Report). College Park, Maryland: Weather Prediction Center. Retrieved March 6, 2012.
- ^ AOE Report – Closed Highways (GIF). United States Weather Bureau (Report). National Hurricane Center; National Oceanic and Atmospheric Administration. June 26, 1960. Retrieved April 26, 2013.
- ^ Information For Highway Patrol (GIF). United States Weather Bureau (Report). National Hurricane Center; National Oceanic and Atmospheric Administration. June 26, 1960. Retrieved April 26, 2013.
- ^ Roth, David M (May 12, 2022). "Maximum Rainfall caused by North Atlantic and Northeast Pacific Tropical Cyclones and their remnants Per State (1950–2020)". Tropical Cyclone Rainfall. United States Weather Prediction Center. Retrieved January 6, 2023.
 This article incorporates text from this source, which is in the public domain.
- ^ Hurricane Abby Preliminary Report. United States Weather Bureau (Report). Miami, Florida: National Oceanic and Atmospheric Administration; National Hurricane Center. 1960. p. 2. Retrieved April 29, 2013.
- ^ "Abby Breaking Up In Honduras". Ocala Star-Banner. Associated Press. July 15, 1960. p. 4. Retrieved May 6, 2013.
- ^ a b Richard D. Geppert (August 3, 1960). Hurricane Abby. United States Weather Bureau (Report). Miami, Florida: National Hurricane Center; National Oceanic and Atmospheric Administration. Retrieved May 6, 2013.
- ^ a b c Keith Butson (August 11, 1960). Report on incipient tropical storm Brenda, July 28–29, 1960 (GIF). United States Weather Bureau (Report). National Hurricane Center; National Oceanic and Atmospheric Administration. Retrieved April 26, 2013.
- ^ Roth, David M (May 12, 2022). "Tropical Cyclone Rainfall in the Southeastern United States". Tropical Cyclone Rainfall. United States Weather Prediction Center. Retrieved January 6, 2023. This article incorporates text from this source, which is in the public domain.
- ^ Preliminary Report on Hurricane Cleo, August 18–20, 1960. United States Weather Bureau (Report). Miami, Florida: National Hurricane Center; National Oceanic and Atmospheric Administration. p. 1. Retrieved May 6, 2013.
- ^ a b c d e f g h i "Atlantic hurricane best track (HURDAT version 2)" (Database). United States National Hurricane Center. April 5, 2023. Retrieved April 9, 2024. This article incorporates text from this source, which is in the public domain.
- ^ a b Davis (August 18, 1960). Miami Weather Bureau Bulletin. United States Weather Bureau (Report). Miami: National Hurricane Center; National Oceanic and Atmospheric Administration. p. 3. Retrieved May 6, 2013.
- ^ a b Late Twentieth Century. National Oceanic and Atmospheric Administration (Report). College Park, Maryland: Weather Prediction Center. March 1, 2007. Retrieved May 6, 2013.
- ^ 1. Category A – Flood Report NR 2.2 A. Telephone Reports. United States Weather Bureau (Report). National Hurricane Center; National Oceanic and Atmospheric Administration. 1960. p. 1. Retrieved February 24, 2013.
- ^ Hurricane Donna – September 3–13, 1960. United States Weather Bureau (Report). Miami, Florida: National Hurricane Center; National Oceanic and Atmospheric Administration. September 27, 1960. p. 2. Retrieved May 6, 2013.
- ^ a b c d e Storm Data and Unusual Weather Phenomena: September 1960 (PDF). National Climatic Data Center (Report). Asheville, North Carolina: National Oceanic and Atmospheric Administration. 1960. pp. 111–115. Archived from the original (PDF) on 2013-05-09. Retrieved May 6, 2013.
- ^ Hurricane Ethel Preliminary Report (PDF). United States Weather Bureau (Report). National Hurricane Center; National Oceanic and Atmospheric Administration. December 27, 1960. Retrieved November 28, 2009.
- ^ Robert A. Morton (2007). Historical Changes in the Mississippi-Alabama Barrier Islands and the Roles of Extreme Storms, Sea Level, and Human Activities (PDF) (Report). United States Geological Survey. Retrieved May 23, 2010.
- ^ "Hurricane Ethel rips coast of Mississippi". The Bulletin. Bend, Oregon. United Press International. September 15, 1960. p. 1. Retrieved October 13, 2021.
- ^ a b David M. Roth (October 5, 2009). Hurricane Ethel – September 14–17, 1960. Weather Prediction Center (Report). National Oceanic and Atmospheric Administration. Retrieved May 24, 2010.
- ^ "Ethel". St. Petersburg Times. Associated Press. September 16, 1960. p. 2. Retrieved May 24, 2010.
- ^ "Ethel Hits 3 Coastal Cities, Then Fades Out Over Land". St. Petersburg Times. Mobile, Alabama. Associated Press. September 16, 1960. p. 1. Retrieved May 24, 2010.
- ^ a b "Cleanup slowed in wake of Hurricane Ethel". The Bulletin. Bend, Oregon. United Press International. September 16, 1960. p. 6. Retrieved May 24, 2010.
- ^ a b Gilbert B. Clark (September 24, 1960). "Miami Weather Bureau Bulletin" (GIF). United States Weather Bureau Office Miami, Florida. Miami, Florida: National Oceanic and Atmospheric Administration; National Hurricane Center. Retrieved April 28, 2013.
- ^ David M. Roth (December 20, 2009). Tropical Storm Florence – September 19–27, 1960. Weather Prediction Center (Report). College Park, Maryland: National Oceanic and Atmospheric Administration. Retrieved April 28, 2013.
- ^ Gilbert P. Clark (September 23, 1960). Miami Weather Bureau Bulletin (GIF). United States Weather Bureau Office Miami, Florida (Report). Miami, Florida: National Oceanic and Atmospheric Administration; National Hurricane Center. Retrieved April 28, 2013.
- ^ "Hurricanes-to-Be Named". Pittsburgh Post-Gazette. February 13, 1960. p. 3. Retrieved February 11, 2021 – via Newspapers.com.
- ^ Tropical Cyclone Naming History and Retired Names. National Hurricane Center (Report). Miami: National Oceanic and Atmospheric Administration. April 11, 2013. Retrieved April 22, 2013.
- ^ "Roll of Hurricanes Starts with Abby". Reading Eagle. Associated Press. June 24, 1964. Retrieved June 10, 2013.
- ^ Storm Data and Unusual Weather Phenomena: June 1960 (PDF). National Climatic Data Center (Report). Asheville, North Carolina: National Oceanic and Atmospheric Administration. 1960. Archived from the original (PDF) on October 13, 2021. Retrieved October 13, 2021.
- ^ Edward N. Rappaport; Jose Fernandez-Partagas; Jack L. Beven (April 22, 1997). The Deadliest Atlantic Tropical Cyclones, 1492–1996. National Hurricane Center (Report). National Oceanic and Atmospheric Administration. Archived from the original on May 14, 2011. Retrieved March 6, 2012.
- ^ 1960-Donna (Report). Environment Canada. November 5, 2009. Archived from the original on March 13, 2013. Retrieved October 13, 2021.
External links[edit]
Tropical cyclones of the 1960 Atlantic hurricane season | ||
|---|---|---|
| ||