From Wikipedia, the free encyclopedia
Russian legislative constituency
| Buryatia single-member constituency |
|---|
|
 |
| Deputy | |
|---|
| Federal subject | Republic of Buryatia |
|---|
| Districts | Barguzinsky, Bauntovsky, Bichursky, Dzhidinsky, Ivolginsky, Kabansky, Khorinsky, Kizhinginsky, Kurumkansky, Kyakhtinsky, Muysky, Mukhorshibirsky, Okinsky, Pribaykalsky, Selenginsky, Severo-Baykalsky, Severobaykalsk, Tarbagataysky, Tunkinsky, Ulan-Ude, Yeravninsky, Zaigrayevsky, Zakamensky[1] |
|---|
| Voters | 695,619 (2021)[2] |
|---|
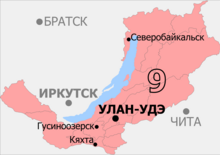
The Buryatia Constituency (No.9[a]) is a Russian legislative constituency in the Republic of Buryatia. The constituency is the only one in Buryatia, and occupies the whole of its territory.
Members elected[edit]
Election results[edit]
Summary of the 17 December 1995 Russian legislative election in the Buryatia constituency
| Candidate
|
Party
|
Votes
|
%
|
|
|
Svetlana Naychukova
|
Independent
|
93,912
|
21.76%
|
|
|
Nikolay Kondakov (incumbent)
|
Communist Party
|
80,260
|
18.60%
|
|
|
Vladimir Belousov
|
Our Home – Russia
|
56,898
|
13.19%
|
|
|
Nimazhap Ilyukhinov
|
Independent
|
35,714
|
8.28%
|
|
|
Arnold Tulokhonov
|
Independent
|
32,745
|
7.59%
|
|
|
Vladimir Markov
|
Independent
|
22,007
|
5.10%
|
|
|
Tsyrzhima Sergeeva
|
Independent
|
19,800
|
4.59%
|
|
|
Vladimir Prokopyev
|
Independent
|
12,001
|
2.78%
|
|
|
Bayar Tumurov
|
Beer Lovers Party
|
7,614
|
1.76%
|
|
|
against all
|
58,328
|
13.52%
|
|
|
| Total
|
431,525
|
100%
|
|
|
| Source:
|
[4]
|
Summary of the 19 December 1999 Russian legislative election in the Buryatia constituency
| Candidate
|
Party
|
Votes
|
%
|
|
|
Bato Semenov
|
Fatherland – All Russia
|
136,960
|
34.99%
|
|
|
Viktor Izmaylov
|
Independent
|
78,421
|
20.03%
|
|
|
Sergey Budazhapov
|
Communist Party
|
54,298
|
13.87%
|
|
|
Svetlana Naychukova (incumbent)
|
Independent
|
21,959
|
5.61%
|
|
|
Vladimir Markov
|
Spiritual Heritage
|
20,888
|
5.34%
|
|
|
Yevgeny Paltsev
|
Independent
|
13,332
|
3.41%
|
|
|
Svetlana Zangeeva
|
Independent
|
6,139
|
1.57%
|
|
|
Oleg Khomutov
|
Independent
|
5,965
|
1.52%
|
|
|
Igor Pronkin
|
Independent
|
5,624
|
1.44%
|
|
|
Tsyrzhima Sergeeva
|
Independent
|
5,327
|
1.36%
|
|
|
against all
|
32,640
|
8.34%
|
|
|
| Total
|
391,466
|
100%
|
|
|
| Source:
|
[5]
|
Summary of the 17-19 September 2021 Russian legislative election in the Buryatia constituency
| Candidate
|
Party
|
Votes
|
%
|
|
|
Vyacheslav Damdintsurunov
|
United Russia
|
115,716
|
37.41%
|
|
|
Bair Tsyrenov
|
Communist Party
|
61,429
|
19.86%
|
|
|
Sergey Zverev
|
The Greens
|
23,081
|
7.46%
|
|
|
Igor Bobkov
|
Party of Pensioners
|
22,692
|
7.34%
|
|
|
Maksim Buvalin
|
New People
|
19,628
|
6.35%
|
|
|
Oksana Bukholtseva
|
A Just Russia — For Truth
|
17,338
|
5.61%
|
|
|
Bayar Tsydenov
|
Civic Platform
|
15,565
|
5.03%
|
|
|
Damdin Bolotov
|
Communists of Russia
|
13,060
|
4.22%
|
|
|
Sergey Dorosh
|
Liberal Democratic Party
|
7,234
|
2.34%
|
|
|
Yevgeny Menshikov
|
Russian Party of Freedom and Justice
|
3,278
|
1.06%
|
|
|
| Total
|
309,304
|
100%
|
|
|
| Source:
|
[8]
|
References[edit]


