
Fannin County, Texas
Fannin County | |
|---|---|
 Fannin County Courthouse in Bonham | |
 Location within the U.S. state of Texas | |
 Texas's location within the U.S. | |
| Coordinates: 33°35′N 96°07′W / 33.59°N 96.11°W | |
| Country | |
| State | |
| Founded | 1838 |
| Named for | James Fannin |
| Seat | Bonham |
| Largest city | Bonham |
| Area | |
| • Total | 899 sq mi (2,330 km2) |
| • Land | 891 sq mi (2,310 km2) |
| • Water | 8.0 sq mi (21 km2) 0.9% |
| Population (2020) | |
| • Total | 35,662 |
| • Density | 40/sq mi (15/km2) |
| Time zone | UTC−6 (Central) |
| • Summer (DST) | UTC−5 (CDT) |
| Congressional district | 4th |
| Website | www |
Fannin County is a county in the far northeast of the U.S. state of Texas, on the border with Oklahoma. As of the 2020 census, its population was 35,662.[1] The county seat is Bonham.[2]
The county was named for James Fannin,[3] who commanded the group of Texans killed in the Goliad Massacre during the Texas Revolution. James Bonham (the county seat's namesake) sought Fannin's assistance for the Battle of the Alamo, but Fannin was unable to provide it.
The county was created in 1837 and organized the next year.[4][5] Fannin County is a part of the Texoma region.
Geography[edit]
According to the U.S. Census Bureau, the county has a total area of 899 square miles (2,330 km2), of which 891 square miles (2,310 km2) are land and 8.0 square miles (21 km2) (0.9%) are covered by water.[6] It is drained by Bois D'Arc Creek and Sulphur River.[7]
Major highways[edit]
 U.S. Highway 69
 U.S. Highway 82
 State Highway 11
 State Highway 34
 State Highway 50
 State Highway 56
 State Highway 78
 State Highway 121
Adjacent counties[edit]
- Bryan County, Oklahoma (north)
- Lamar County (east)
- Delta County (southeast)
- Hunt County (south)
- Collin County (southwest)
- Grayson County (west)
National protected area[edit]
Demographics[edit]
| Census | Pop. | Note | %± |
|---|---|---|---|
| 1850 | 3,788 | — | |
| 1860 | 9,217 | 143.3% | |
| 1870 | 13,207 | 43.3% | |
| 1880 | 25,501 | 93.1% | |
| 1890 | 38,709 | 51.8% | |
| 1900 | 51,793 | 33.8% | |
| 1910 | 44,801 | −13.5% | |
| 1920 | 48,186 | 7.6% | |
| 1930 | 41,163 | −14.6% | |
| 1940 | 41,064 | −0.2% | |
| 1950 | 31,253 | −23.9% | |
| 1960 | 23,880 | −23.6% | |
| 1970 | 22,705 | −4.9% | |
| 1980 | 24,285 | 7.0% | |
| 1990 | 24,804 | 2.1% | |
| 2000 | 31,242 | 26.0% | |
| 2010 | 33,915 | 8.6% | |
| 2020 | 35,662 | 5.2% | |
| U.S. Decennial Census[8] 1850–2010[9] 2010–2014[10] County Information Program[11] | |||
| Race / Ethnicity | Pop 2010[12] | Pop 2020[13] | % 2010 | % 2020 |
|---|---|---|---|---|
| White alone (NH) | 27,433 | 27,042 | 80.89% | 75.83% |
| Black or African American alone (NH) | 2,273 | 2,199 | 6.70% | 6.17% |
| Native American or Alaska Native alone (NH) | 294 | 309 | 0.87% | 0.87% |
| Asian alone (NH) | 122 | 145 | 0.36% | 0.41% |
| Pacific Islander alone (NH) | 6 | 20 | 0.02% | 0.06% |
| Some Other Race alone (NH) | 23 | 112 | 0.07% | 0.31% |
| Mixed Race/Multi-Racial (NH) | 538 | 1,617 | 1.59% | 4.53% |
| Hispanic or Latino (any race) | 3,226 | 4,218 | 9.51% | 11.83% |
| Total | 33,915 | 35,662 | 100.00% | 100.00% |
Note: the US Census treats Hispanic/Latino as an ethnic category. This table excludes Latinos from the racial categories and assigns them to a separate category. Hispanics/Latinos can be of any race.
As of the census[14] of 2000, 31,242 people, 11,105 households, and 7,984 were families residing in the county. The population density was 35 people per square mile (14 people/km2). The 12,887 housing units averaged 14 units per square mile (5.4/km2). The racial makeup of the county was 86.56% White, 7.96% African American, 0.92% Native American, 0.26% Asian, 2.81% from other races, and 1.49% from two or more races. About 5.61% of the population was Hispanic or Latino of any race. As of 2015, the largest self-reported ancestry groups were 48.50% English, 16.10% Welsh, 11.00% German, and 7.25% Irish.
Of the 11,105 households, 31.10% had children under the age of 18 living with them, 57.90% were married couples living together, 10.30% had a female householder with no husband present, and 28.10% were not families. About 25.20% of all households were made up of individuals, and 12.70% had someone living alone who was 65 years of age or older. The average household size was 2.51, and the average family size was 2.99.
In the county, the population was distributed as 23.20% under the age of 18, 8.90% from 18 to 24, 28.60% from 25 to 44, 23.20% from 45 to 64, and 16.10% who were 65 years of age or older. The median age was 38 years. For every 100 females, there were 113.80 males. For every 100 females age 18 and over, there were 116.90 males.
The median income for a household in the county was $34,501, and for a family was $42,193. Males had a median income of $31,140 versus $23,101 for females. The per capita income for the county was $16,066. About 9.90% of families and 13.90% of the population were below the poverty line, including 17.70% of those under age 18 and 16.50% of those age 65 or over.
Communities[edit]
Cities[edit]
- Bailey
- Bonham (county seat)
- Ector
- Honey Grove
- Leonard
- Pecan Gap (mostly in Delta County)
- Ravenna
- Savoy
- Trenton (small part in Grayson County)
Towns[edit]
- Dodd City
- Ladonia
- Whitewright (mostly in Grayson County)[15]
- Windom
Unincorporated communities[edit]
Education[edit]
These school districts serve Fannin County:
- Bonham ISD
- Dodd City ISD
- Ector ISD
- Fannindel ISD
- Honey Grove ISD
- Leonard ISD
- Sam Rayburn ISD
- Savoy ISD
- Trenton ISD (mostly Fannin County, small part in Grayson County)
- Whitewright ISD (mostly in Grayson County, small portion in Fannin County)
Additionally, nearby Grayson College, Paris Junior College, and Texas A&M University–Commerce provide post-secondary education in the area.
Politics[edit]
Once a Democratic stronghold for decades (in large part as it was the home of longtime United States Speaker of the House Sam Rayburn), Fannin County has shifted heavily toward the Republican Party since the 1990s. As a sign of this trend, Republican candidates for president have won an ever-increasing share of the vote in each of the seven presidential elections, starting in 1996.
| Year | Republican | Democratic | Third party | |||
|---|---|---|---|---|---|---|
| No. | % | No. | % | No. | % | |
| 2020 | 12,171 | 81.10% | 2,655 | 17.69% | 181 | 1.21% |
| 2016 | 9,548 | 79.28% | 2,132 | 17.70% | 364 | 3.02% |
| 2012 | 8,161 | 75.54% | 2,486 | 23.01% | 157 | 1.45% |
| 2008 | 8,092 | 69.20% | 3,464 | 29.62% | 138 | 1.18% |
| 2004 | 7,893 | 65.99% | 4,001 | 33.45% | 66 | 0.55% |
| 2000 | 6,074 | 58.74% | 4,102 | 39.67% | 164 | 1.59% |
| 1996 | 3,495 | 39.73% | 4,276 | 48.61% | 1,025 | 11.65% |
| 1992 | 2,510 | 26.11% | 4,164 | 43.31% | 2,941 | 30.59% |
| 1988 | 4,024 | 43.67% | 5,163 | 56.03% | 27 | 0.29% |
| 1984 | 4,692 | 51.53% | 4,399 | 48.31% | 15 | 0.16% |
| 1980 | 3,196 | 37.12% | 5,284 | 61.36% | 131 | 1.52% |
| 1976 | 2,102 | 26.32% | 5,845 | 73.20% | 38 | 0.48% |
| 1972 | 3,826 | 61.90% | 2,295 | 37.13% | 60 | 0.97% |
| 1968 | 1,585 | 22.08% | 3,931 | 54.77% | 1,661 | 23.14% |
| 1964 | 1,219 | 16.93% | 5,976 | 83.00% | 5 | 0.07% |
| 1960 | 1,844 | 30.04% | 4,282 | 69.76% | 12 | 0.20% |
| 1956 | 1,910 | 29.75% | 4,504 | 70.16% | 6 | 0.09% |
| 1952 | 2,099 | 28.12% | 5,363 | 71.84% | 3 | 0.04% |
| 1948 | 553 | 7.83% | 6,132 | 86.79% | 380 | 5.38% |
| 1944 | 677 | 9.45% | 5,984 | 83.54% | 502 | 7.01% |
| 1940 | 792 | 9.57% | 7,478 | 90.36% | 6 | 0.07% |
| 1936 | 368 | 6.55% | 5,242 | 93.32% | 7 | 0.12% |
| 1932 | 460 | 7.91% | 5,338 | 91.80% | 17 | 0.29% |
| 1928 | 2,122 | 45.62% | 2,525 | 54.29% | 4 | 0.09% |
| 1924 | 653 | 10.11% | 5,596 | 86.60% | 213 | 3.30% |
| 1920 | 1,103 | 21.29% | 3,461 | 66.79% | 618 | 11.93% |
| 1916 | 471 | 11.19% | 3,493 | 82.99% | 245 | 5.82% |
| 1912 | 227 | 7.25% | 2,661 | 85.04% | 241 | 7.70% |
See also[edit]
- National Register of Historic Places listings in Fannin County, Texas
- Recorded Texas Historic Landmarks in Fannin County
References[edit]
- ^ "Fannin County, Texas". United States Census Bureau. Retrieved January 30, 2022.
- ^ "Find a County". National Association of Counties. Archived from the original on May 31, 2011. Retrieved June 7, 2011.
- ^ Gannett, Henry (1905). The Origin of Certain Place Names in the United States. Govt. Print. Off. pp. 123.
- ^ "Texas: Individual County Chronologies". Texas Atlas of Historical County Boundaries. The Newberry Library. 2008. Archived from the original on April 12, 2017. Retrieved June 20, 2015.
- ^ "Fannin County". Texas Almanac. Texas State Historical Association. Retrieved June 20, 2015.
- ^ "2010 Census Gazetteer Files". United States Census Bureau. August 22, 2012. Retrieved April 26, 2015.
- ^ Ripley, George; Dana, Charles A., eds. (1879). . The American Cyclopædia.
- ^ "Decennial Census of Population and Housing by Decades". US Census Bureau.
- ^ "Texas Almanac: Population History of Counties from 1850–2010" (PDF). Texas Almanac. Archived (PDF) from the original on October 9, 2022. Retrieved April 26, 2015.
- ^ "State & County QuickFacts". United States Census Bureau. Archived from the original on June 24, 2011. Retrieved December 16, 2013.
- ^ "Fannin County Profile". Retrieved November 18, 2019.
- ^ "P2 HISPANIC OR LATINO, AND NOT HISPANIC OR LATINO BY RACE - 2010: DEC Redistricting Data (PL 94-171) - Fannin County, Texas". United States Census Bureau.
- ^ "P2 HISPANIC OR LATINO, AND NOT HISPANIC OR LATINO BY RACE - 2020: DEC Redistricting Data (PL 94-171) - Fannin County, Texas". United States Census Bureau.
- ^ "U.S. Census website". United States Census Bureau. Retrieved May 14, 2011.
- ^ "Texas Cities and Towns Sorted by County". www.county.org. Archived from the original on December 26, 2016. Retrieved December 26, 2016.
- ^ Leip, David. "Dave Leip's Atlas of U.S. Presidential Elections". uselectionatlas.org. Retrieved January 22, 2021.
External links[edit]
![]() Media related to Fannin County, Texas at Wikimedia Commons
Media related to Fannin County, Texas at Wikimedia Commons
- Fannin County government's website
- Fannin County from the Handbook of Texas Online
Places adjacent to Fannin County, Texas | ||||||||||||||||
|---|---|---|---|---|---|---|---|---|---|---|---|---|---|---|---|---|
| ||||||||||||||||
Municipalities and communities of Fannin County, Texas, United States | ||
|---|---|---|
| Cities | 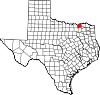 | |
| Towns | ||
| Unincorporated communities | ||
| Footnotes | ‡This populated place also has portions in an adjacent county or counties | |
33°35′N 96°07′W / 33.59°N 96.11°W
| International | |
|---|---|
| National | |
| Other | |