File:ArTimeSeries.svg

Size of this PNG preview of this SVG file: 685 × 448 pixels. Other resolutions: 320 × 209 pixels | 640 × 419 pixels | 1,024 × 670 pixels | 1,280 × 837 pixels | 2,560 × 1,674 pixels.
Original file (SVG file, nominally 685 × 448 pixels, file size: 177 KB)
File history
Click on a date/time to view the file as it appeared at that time.
| Date/Time | Thumbnail | Dimensions | User | Comment | |
|---|---|---|---|---|---|
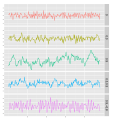
| current | 04:28, 15 January 2013 |  | 685 × 448 (177 KB) | Everettr2 | I tried to clarify the identity of each of the five plots in the graph. |
| 20:16, 13 January 2013 |  | 604 × 448 (167 KB) | Everettr2 | Reverted to version as of 22:28, 30 March 2011 | |
| 20:15, 13 January 2013 |  | 612 × 792 (227 KB) | Everettr2 | Trying to clearly identify each of the 5 plots in the graph | |
| 20:14, 13 January 2013 |  | 604 × 448 (167 KB) | Everettr2 | Reverted to version as of 22:28, 30 March 2011 | |
| 19:41, 13 January 2013 |  | 612 × 792 (192 KB) | Everettr2 | Added descriptive elements to better identify each of the five plots in the graphic. | |
| 22:28, 30 March 2011 |  | 604 × 448 (167 KB) | Tomaschwutz | changed to area between zero and line instead of line only | |
| 17:44, 30 March 2011 |  | 488 × 519 (167 KB) | Tomaschwutz | {{Information |Description ={{en|1=Timeseries of several AR(p) processes with standard deviation of the noise of 1}} |Source ={{own}} |Author =Tomaschwutz |Date =2011-03-30 |Permission = |other_version |
File usage
The following pages on the English Wikipedia use this file (pages on other projects are not listed):
Global file usage
The following other wikis use this file:
- Usage on ja.wikipedia.org
- Usage on ko.wikipedia.org
- Usage on uk.wikipedia.org
