
File:Cloud computing economics.svg

Size of this PNG preview of this SVG file: 483 × 444 pixels. Other resolutions: 261 × 240 pixels | 522 × 480 pixels | 836 × 768 pixels | 1,114 × 1,024 pixels | 2,228 × 2,048 pixels.
Original file (SVG file, nominally 483 × 444 pixels, file size: 13 KB)
| This is a file from the Wikimedia Commons. Information from its description page there is shown below. Commons is a freely licensed media file repository. You can help. |
Summary
| Description |
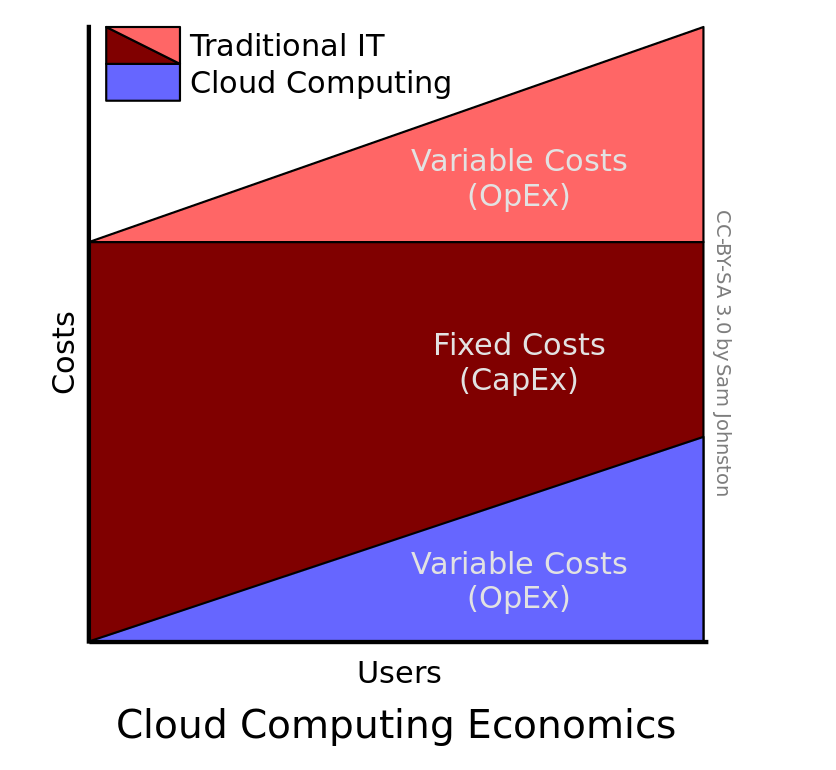
English: Diagram showing economics of cloud computing versus traditional IT, including capital expenditure (CapEx) and operational expenditure (OpEx)
Català: Diagrama que compara l'economia de les empreses d'informàtica al núvol contra la d'una IT tradicional, mostrant el CapEx i l'OpEx. |
| Date | |
| Source | Created by Sam Johnston using OminGroup's OmniGraffle |
| Author | Sam Johnston |
| Other versions |
File:Cloud computing economics.svg has 3 translations.
|


Although this diagram is meant to be qualitative, some effort went into the quantitative analysis too. The justification for the splits are a Forrester paper showing that the total cost of cloud computing deployments were 1/3 of that of traditional systems[1] and a CIO magazine article showing that variable costs traditionally account for 30-35% of overall spend[2].
References
Licensing
I, the copyright holder of this work, hereby publish it under the following license:
This file is licensed under the Creative Commons Attribution-Share Alike 3.0 Unported license.
- You are free:
- to share – to copy, distribute and transmit the work
- to remix – to adapt the work
- Under the following conditions:
- attribution – You must give appropriate credit, provide a link to the license, and indicate if changes were made. You may do so in any reasonable manner, but not in any way that suggests the licensor endorses you or your use.
- share alike – If you remix, transform, or build upon the material, you must distribute your contributions under the same or compatible license as the original.
File history
Click on a date/time to view the file as it appeared at that time.
| Date/Time | Thumbnail | Dimensions | User | Comment | |
|---|---|---|---|---|---|
| current | 09:09, 29 April 2024 | | 483 × 444 (13 KB) | Cataleirxs | File uploaded using svgtranslate tool (https://svgtranslate.toolforge.org/). Added translation for ca. |
| 02:14, 6 March 2009 |  | 483 × 444 (7 KB) | SamJohnston | {{Information |Description={{en|1=Diagram showing economics of cloud computing versus traditional IT, including capital expenditure (CapEx) and operational expenditure (OpEx)}} |Source=Created by Sam Johnston using OminGroup's [[Wi |
File usage
The following pages on the English Wikipedia use this file (pages on other projects are not listed):
Global file usage
The following other wikis use this file:
- Usage on ca.wikipedia.org
- Usage on fr.wikipedia.org
- Usage on hi.wikipedia.org
- Usage on hu.wikipedia.org