
File:Conic x^2+2xy+y^2−8x=0.svg

Size of this PNG preview of this SVG file: 743 × 470 pixels. Other resolutions: 320 × 202 pixels | 640 × 405 pixels | 1,024 × 648 pixels | 1,280 × 810 pixels | 2,560 × 1,619 pixels.
Original file (SVG file, nominally 743 × 470 pixels, file size: 98 KB)
| This is a file from the Wikimedia Commons. Information from its description page there is shown below. Commons is a freely licensed media file repository. You can help. |
Summary
| Description |
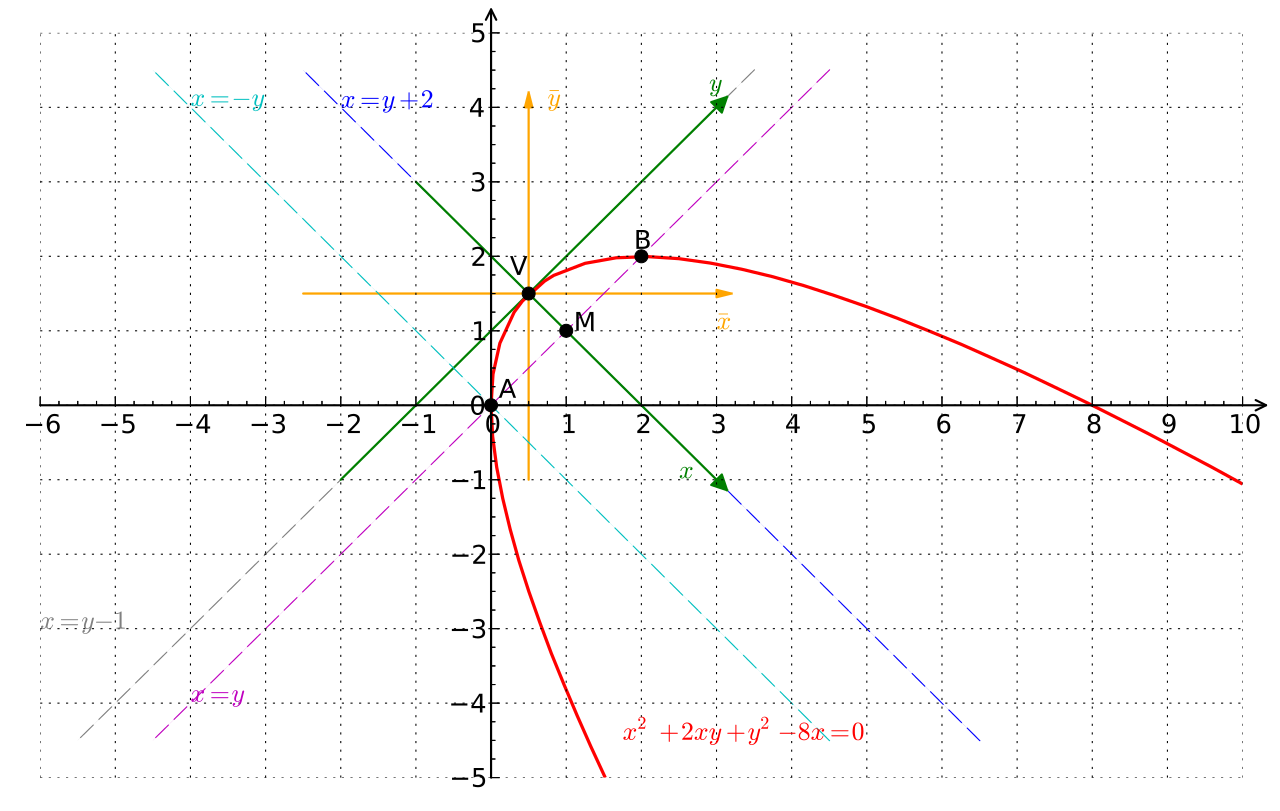
English: Graph of the conic Italiano: Grafico della conica |
| Date | |
| Source | Own work |
| Author | Krishnavedala |
| Other versions | Graph of conic |


W3C-validity not checked.
Python Script
Requirements: python-2.6 with numpy and matplotlib-1.0.1
from matplotlib.pyplot import *
from numpy import *
from mpl_toolkits.axes_grid.axislines import SubplotZero

X = linspace(0,10,25)
Y = linspace(-5,5,25)
x, y = meshgrid(X,Y)

fig = figure(figsize=(10,6))
ax = SubplotZero(fig,111)
fig.add_subplot(ax)
for direction in ["xzero","yzero"]:
	ax.axis[direction].set_visible(True)
	ax.axis[direction].set_axisline_style("->")
for direction in ["top","bottom","left","right"]:
	ax.axis[direction].set_visible(False)
ax.axis["yzero"].set_axis_direction("left")
ax.grid(True)
ax.minorticks_on()

ax.contour(x,y, x**2 + 2.*x*y +y**2 - 8.*x, [0],linewidths=1.5,colors='r')
ax.text(1.75,-4.5,r'$x^2+2xy+y^2-8x=0$',color='r')
ax.arrow(.5,-1,0,5,color='orange',head_width=.1,head_length=.2)
ax.text(.75,4,r'$\bar{y}$',color='orange')
ax.arrow(-2.5,1.5,5.5,0,color='orange',head_width=.1,head_length=.2)
ax.text(3,1,r'$\bar{x}$',color='orange')
ax.plot(.5,1.5,'ko')
ax.text(.25,1.75,r'V')

ax.arrow(-4.5,-4.5,9,9,color='m',ls='dashed',lw=.5), ax.text(-4,-4,r'$x=y$',color='m')
ax.arrow(-5.5,-4.5,9,9,color='grey',ls='dashed',lw=.5), ax.text(-6,-3,r'$x=y-1$',color='grey')
ax.arrow(-2,-1,5,5,color='g',head_width=.2,head_length=.2), ax.text(2.9,4.2,r'$y$',color='g')
ax.arrow(-4.5,4.5,9,-9,color='c',ls='dashed',lw=.5), ax.text(-4,4,r'$x=-y$',color='c')
ax.arrow(-2.5,4.5,9,-9,color='b',ls='dashed',lw=.5), ax.text(-2,4,r'$x=y+2$',color='b')
ax.arrow(-1,3,4,-4,color='g',head_width=.2,head_length=.2), ax.text(2.5,-1,r'$x$',color='g')

ax.plot([0,1,2],[0,1,2],'ko')
ax.text(.1,.1,r'A'), ax.text(1.1,1,r'M'), ax.text(1.9,2.1,r'B')

#ax.text(10,.1,"x")
#ax.text(.1,5,"y")
xticks(arange(-6,11,1))
yticks(arange(-5,6,1))
ax.set_ylim(-5,5)
ax.set_xlim(-6,10)
fig.savefig("Test.svg",bbox_inches="tight",\
        pad_inches=.15)
Licensing
I, the copyright holder of this work, hereby publish it under the following license:
| This file is made available under the Creative Commons CC0 1.0 Universal Public Domain Dedication. | |
| The person who associated a work with this deed has dedicated the work to the public domain by waiving all of their rights to the work worldwide under copyright law, including all related and neighboring rights, to the extent allowed by law. You can copy, modify, distribute and perform the work, even for commercial purposes, all without asking permission.
|
File history
Click on a date/time to view the file as it appeared at that time.
| Date/Time | Thumbnail | Dimensions | User | Comment | |
|---|---|---|---|---|---|
| current | 20:38, 1 September 2011 | | 743 × 470 (98 KB) | Krishnavedala |
File usage
No pages on the English Wikipedia use this file (pages on other projects are not listed).