
File:Detrended fluctuation analysis, illustrated with Brownian motion.png

Original file (1,582 × 1,570 pixels, file size: 454 KB, MIME type: image/png)
| This is a file from the Wikimedia Commons. Information from its description page there is shown below. Commons is a freely licensed media file repository. You can help. |
Summary
| Description |
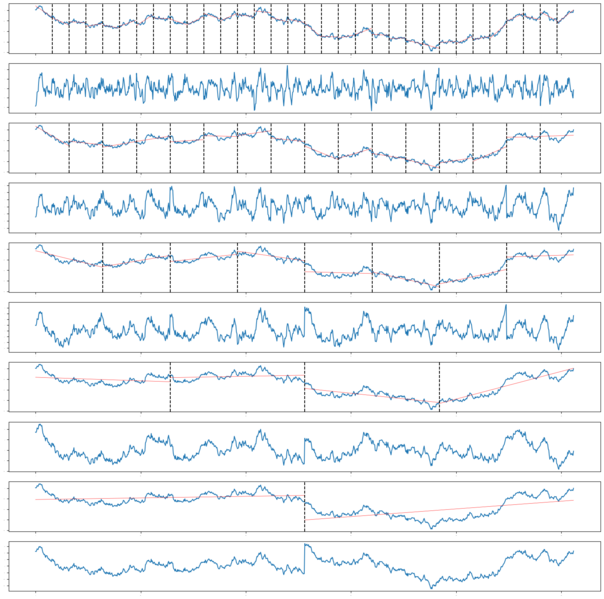
English: Input:
`xs`: a time series `n`: segment length `N = len(xs)` `d = floor(N/n)` `ys = np.zeros(d*n)` `mean_x = mean(xs)` `Xs = cumsum(xs - mean_x)` 1. Initialize a plt plot with three subplots, using `fig, axes = subplot_mosaic("A;B", figsize=(20, 20))` 2. On `axes["A"]` plot `Xs`. 3. Divide `Xs` into consecutive segments of length `n`. For each of the `d` segments, fit a linear trend by least squares, plot it on `axes["A"]`, as a thin red line. add a black dashed vertical line at the end of the segment. Store the detrended values to the corresponding segment in `ys` 4. Plot `ys` on `axes["B"]`
def perform_DFA(xs, n, axa, axb): N = len(xs) d = np.floor(N/n).astype(int) ys = np.zeros(d*n) # Compute the cumulative sum Xs mean_x = np.mean(xs) Xs = np.cumsum(xs - mean_x) # Plot Xs on axes["A"] axa.plot(Xs, label='Cumulative sum') # Linear regression model for fitting trends model = LinearRegression() # Loop over the segments
for i in range(d):
# Extract the current segment
segment = Xs[i*n:(i+1)*n]
# Fit a linear trend by least squares
x = np.arange(n).reshape(-1, 1)
y = segment.reshape(-1, 1)
model.fit(x, y)
trend = model.predict(x)
       # Plot the trend
       axa.plot(range(i*n, (i+1)*n), trend, 'r-', linewidth=0.5)
       # Add a black dashed vertical line at the end of the segment
       if i < d - 1:
           axa.axvline(x=(i+1)*n, color='k', linestyle='--')
       # Store the detrended values
       ys[i*n:(i+1)*n] = segment - trend.flatten()
   # Plot detrended time series
   axb.plot(ys)
   # axa.set_title("Cumulative sum with trend lines")
   # axb.set_title("Detrended cumulative series")

   return np.var(ys)
np.random.seed(42)
N = 2**10 xs = np.random.normal(0, 1, N) plt.rcParams.update({'font.size': 0})
fig, axes = plt.subplots(nrows=10, ncols=1, figsize=(20, 20)) for i in range(5, 10): n = 2**i v = perform_DFA(xs, n, axes[2*(i-5)], axes[2*(i-5)+1]) plt.show() ``` |
| Date | |
| Source | Own work |
| Author | Cosmia Nebula |
Licensing
- You are free:
- to share – to copy, distribute and transmit the work
- to remix – to adapt the work
- Under the following conditions:
- attribution – You must give appropriate credit, provide a link to the license, and indicate if changes were made. You may do so in any reasonable manner, but not in any way that suggests the licensor endorses you or your use.
- share alike – If you remix, transform, or build upon the material, you must distribute your contributions under the same or compatible license as the original.

|
This media file is uncategorized.
Please help improve this media file by adding it to one or more categories, so it may be associated with related media files (how?), and so that it can be more easily found.
Please notify the uploader with {{subst:Please link images|File:Detrended fluctuation analysis, illustrated with Brownian motion.png}} ~~~~ |
File history
Click on a date/time to view the file as it appeared at that time.
| Date/Time | Thumbnail | Dimensions | User | Comment | |
|---|---|---|---|---|---|
| current | 04:13, 13 July 2023 | | 1,582 × 1,570 (454 KB) | Cosmia Nebula | Uploaded while editing "Detrended fluctuation analysis" on en.wikipedia.org |
File usage
Global file usage
The following other wikis use this file:
- Usage on el.wikipedia.org
- Usage on fr.wikipedia.org