
File:Fusion rxnrate.svg

Size of this PNG preview of this SVG file: 540 × 405 pixels. Other resolutions: 320 × 240 pixels | 640 × 480 pixels | 1,024 × 768 pixels | 1,280 × 960 pixels | 2,560 × 1,920 pixels.
Original file (SVG file, nominally 540 × 405 pixels, file size: 77 KB)
| This is a file from the Wikimedia Commons. Information from its description page there is shown below. Commons is a freely licensed media file repository. You can help. |
| Description |
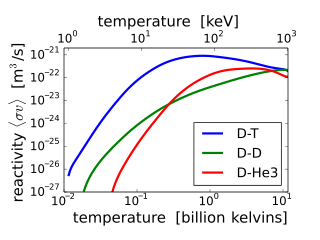
English: Plot of the fusion reactivity (average of cross-section times relative speed of reacting nuclei) vs. temperature for three common reactions. The average is over Maxwellian ion distributions with the appropriate temperature. The plot was made with scientific Python tools using data from the NRL Plasma Formulary, 2006 revision.
Русский: График зависимости активности термоядерной реакции (среднее значение времени сечения и относительной скорости реагирующих ядер) от температуры для трех распространенных реакций. Среднее значение определяется по максвелловскому распределению скоростей ионов с соответствующей температурой. |
| Date | |
| Source | Own work |
| Author | Dstrozzi |
| Other versions |
|


This file is licensed under the Creative Commons Attribution 2.5 Generic license.
- You are free:
- to share – to copy, distribute and transmit the work
- to remix – to adapt the work
- Under the following conditions:
- attribution – You must give appropriate credit, provide a link to the license, and indicate if changes were made. You may do so in any reasonable manner, but not in any way that suggests the licensor endorses you or your use.
File history
Click on a date/time to view the file as it appeared at that time.
| Date/Time | Thumbnail | Dimensions | User | Comment | |
|---|---|---|---|---|---|
| current | 00:36, 1 January 2020 | | 540 × 405 (77 KB) | Mikhail Ryazanov | grammar, hyphens → minuses |
| 05:31, 31 July 2014 |  | 540 × 405 (51 KB) | Dstrozzi~commonswiki | Fixing problems related to Wiki's SVG renderer. | |
| 04:44, 31 July 2014 |  | 540 × 405 (52 KB) | Dstrozzi~commonswiki | Changed y-axis label to match text in English Wikipedia nuclear fusion article. | |
| 15:48, 18 August 2009 |  | 551 × 416 (62 KB) | Dstrozzi~commonswiki | Added kelvin axis, minor re-formatting | |
| 07:19, 5 July 2007 |  | 576 × 432 (50 KB) | Dstrozzi~commonswiki | {{Information |Description=Plot of the fusion reaction rate (average of cross-section times speed) vs. temperature for three common reactions. The average is over Maxwellian ion distributions with the appropriate temperature. The plot was made with scie |
File usage
The following pages on the English Wikipedia use this file (pages on other projects are not listed):
Global file usage
The following other wikis use this file:
- Usage on ar.wikipedia.org
- Usage on bn.wikipedia.org
- Usage on en.wikibooks.org
- Usage on es.wikipedia.org
- Usage on fr.wikipedia.org
- Usage on hr.wikipedia.org
- Usage on pt.wikipedia.org
- Usage on sh.wikipedia.org
- Usage on sr.wikipedia.org
- Usage on ta.wikipedia.org
- Usage on uk.wikipedia.org
- Usage on zh.wikipedia.org