
File:GlobalTemperaturesSince1991.png
Size of this preview: 800 × 494 pixels. Other resolutions: 320 × 197 pixels | 640 × 395 pixels | 1,076 × 664 pixels.
Original file (1,076 × 664 pixels, file size: 46 KB, MIME type: image/png)
| This is a file from the Wikimedia Commons. Information from its description page there is shown below. Commons is a freely licensed media file repository. You can help. |
Summary
| Description |
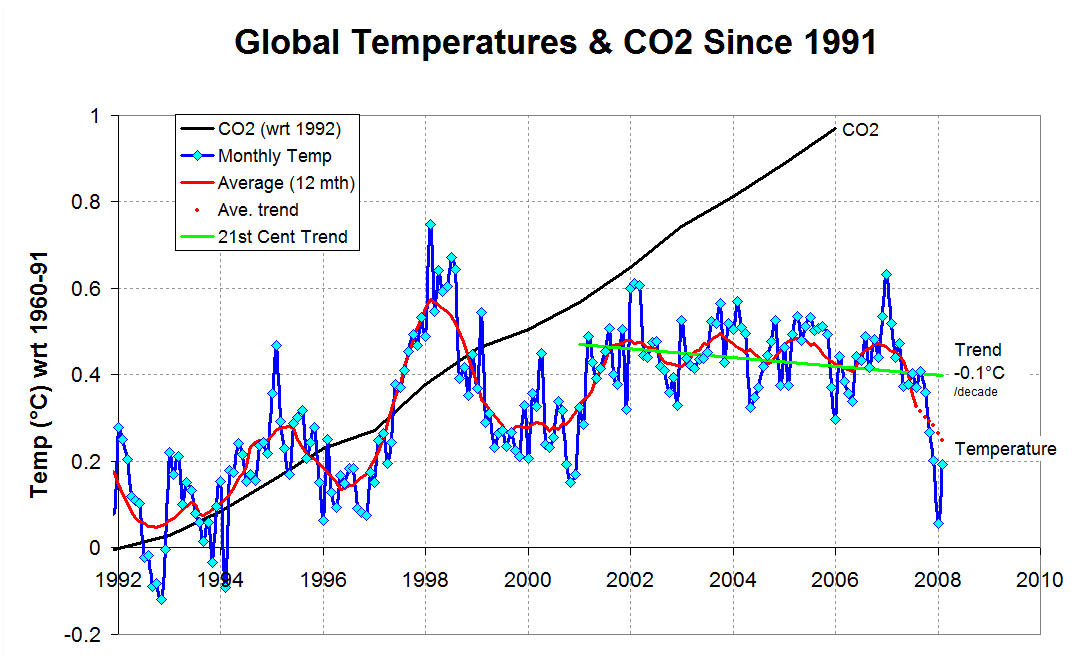
English: This figure shows the Monthly global temperatures after the 1960-1991 average. The data for temperature is relative to the 1960-91 average as is as given by Hadcrut3 [1], the average temperature is a rolling average of 12 months. Carbon dioxide concentrations are yearly averages taken from [2] with scale adjusted so that 1992 is zero.
The primary reason for uploading the file is as a visual aid to highlight that recent trend has been for cooling and so prompt a discussion about the use of phrases such as "recent warming". The CO2 scale ranges from a low value of 356 ppm to a high of 382 ppm[3] |
| Date | 20 February 2008 (original upload date) |
| Source | Transferred from en.wikipedia to Commons by SchuminWeb using CommonsHelper. |
| Author | Isonomia at English Wikipedia |
Licensing
| This work has been released into the public domain by its author, Isonomia at English Wikipedia. This applies worldwide. In some countries this may not be legally possible; if so: Isonomia grants anyone the right to use this work for any purpose, without any conditions, unless such conditions are required by law. |
Original upload log
The original description page was here. All following user names refer to en.wikipedia.
- 2008-03-15 10:11 Isonomia 1076×664× (46975 bytes)
- 2008-02-20 19:41 Isonomia 977×600× (42442 bytes) This figure shows the Monthly global temperatures after the 1960-1991 average. The data for temperature is relative to the 1960-91 average as is as given by Hadcrut3 [http://hadobs.metoffice.com/hadcrut3/diagnostics/global/nh%2Bsh/monthly], the average te
File history
Click on a date/time to view the file as it appeared at that time.
| Date/Time | Thumbnail | Dimensions | User | Comment | |
|---|---|---|---|---|---|
| current | 14:31, 2 June 2011 | | 1,076 × 664 (46 KB) | File Upload Bot (Magnus Manske) | {{BotMoveToCommons|en.wikipedia|year={{subst:CURRENTYEAR}}|month={{subst:CURRENTMONTHNAME}}|day={{subst:CURRENTDAY}}}} {{Information |Description={{en|This figure shows the Monthly global temperatures after the 1960-1991 average. The data for temperature |
File usage
The following pages on the English Wikipedia use this file (pages on other projects are not listed):