
File:Graph of monthly temperature variations in south-west England.png
Size of this preview: 800 × 415 pixels. Other resolutions: 320 × 166 pixels | 640 × 332 pixels | 1,024 × 531 pixels | 1,568 × 813 pixels.
Original file (1,568 × 813 pixels, file size: 203 KB, MIME type: image/png)
| This is a file from the Wikimedia Commons. Information from its description page there is shown below. Commons is a freely licensed media file repository. You can help. |
Summary
| Description |
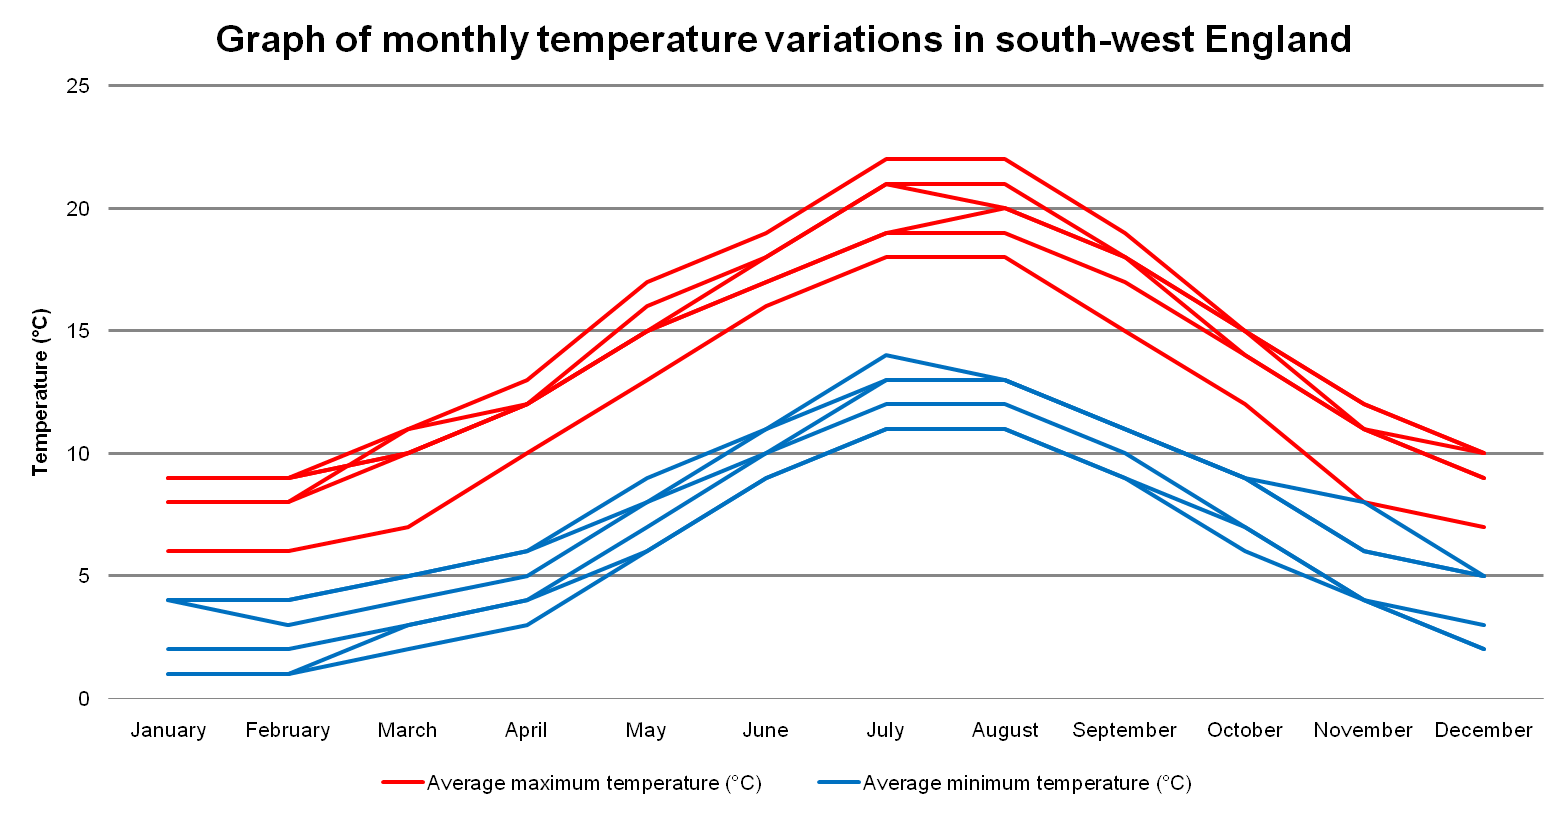
English: A line graph plotting the average monthly minimum and maximum temperatures recorded at eight weather stations across South West England during 1971-2001: Bude, Nettlecombe, Princetown, St. Mawgan, Teignmouth and Yeovilton. |
| Date | |
| Source |
Own work in Microsoft Excel using the following data from the Met Office: |
| Author | Jolly Janner |
Licensing
| I, the copyright holder of this work, release this work into the public domain. This applies worldwide. In some countries this may not be legally possible; if so: I grant anyone the right to use this work for any purpose, without any conditions, unless such conditions are required by law. |
File history
Click on a date/time to view the file as it appeared at that time.
| Date/Time | Thumbnail | Dimensions | User | Comment | |
|---|---|---|---|---|---|
| current | 18:01, 2 August 2009 | | 1,568 × 813 (203 KB) | Jolly Janner | == Summary == {{Information |Description={{en|1=A line graph plotting the average monthly minimum and maximum temperatures recorded at eight weather stations across South West England during 1971-2001: Bude, [[w:Nettlec |
File usage
The following pages on the English Wikipedia use this file (pages on other projects are not listed):