
File:Largest US cities graph.png
Size of this preview: 800 × 581 pixels. Other resolutions: 320 × 232 pixels | 640 × 465 pixels | 1,024 × 743 pixels | 1,280 × 929 pixels | 1,423 × 1,033 pixels.
Original file (1,423 × 1,033 pixels, file size: 372 KB, MIME type: image/png)
| This is a file from the Wikimedia Commons. Information from its description page there is shown below. Commons is a freely licensed media file repository. You can help. |
Summary
| Description |
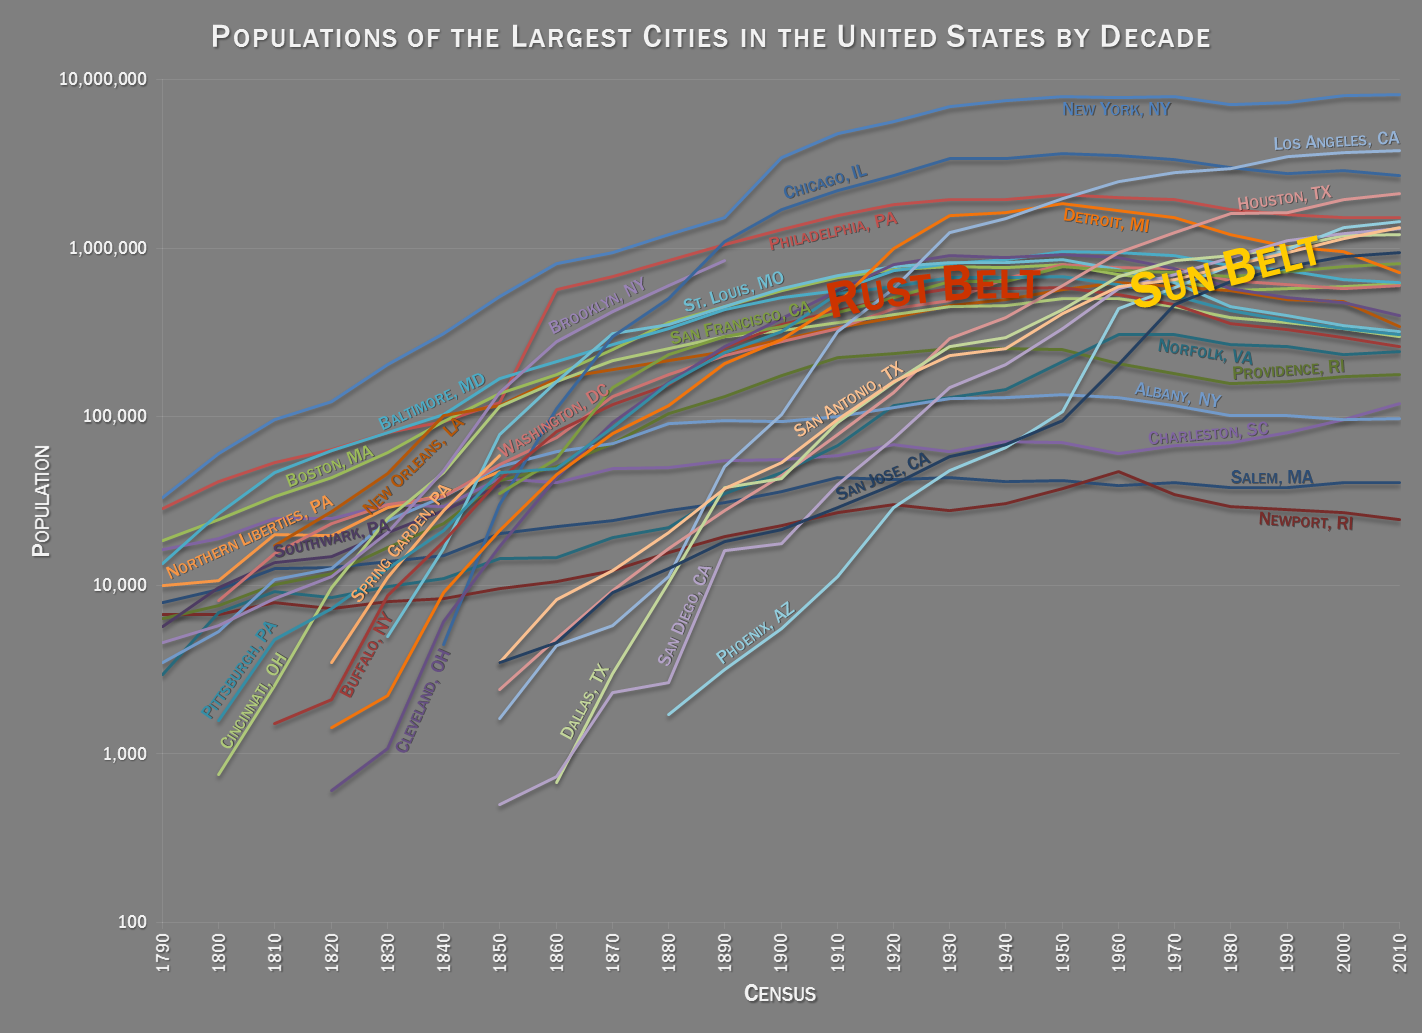
English: A graph of the populations of all cities that are or have been one of the top 10 largest U.S. cities by decade.
Several cities that appear on the list were suburbs of larger cities and were included in metropolitan consolidations in the 19th century:
|
| Date | |
| Source | Own work |
| Author | Little Mountain 5 |
Licensing
I, the copyright holder of this work, hereby publish it under the following licenses:
This file is licensed under the Creative Commons Attribution-Share Alike 3.0 Unported license.
- You are free:
- to share – to copy, distribute and transmit the work
- to remix – to adapt the work
- Under the following conditions:
- attribution – You must give appropriate credit, provide a link to the license, and indicate if changes were made. You may do so in any reasonable manner, but not in any way that suggests the licensor endorses you or your use.
- share alike – If you remix, transform, or build upon the material, you must distribute your contributions under the same or compatible license as the original.

|
Permission is granted to copy, distribute and/or modify this document under the terms of the GNU Free Documentation License, Version 1.2 or any later version published by the Free Software Foundation; with no Invariant Sections, no Front-Cover Texts, and no Back-Cover Texts. A copy of the license is included in the section entitled GNU Free Documentation License. |
You may select the license of your choice.
File history
Click on a date/time to view the file as it appeared at that time.
| Date/Time | Thumbnail | Dimensions | User | Comment | |
|---|---|---|---|---|---|
| current | 17:09, 16 July 2015 | | 1,423 × 1,033 (372 KB) | Cmdrjameson | Compressed with pngout. Reduced by 150kB (28% decrease). |
| 22:46, 3 September 2013 |  | 1,423 × 1,033 (522 KB) | Little Mountain 5 | Attempt to make more visually appealing and readable, fix New York and Newport, other minor tweaks | |
| 00:20, 13 September 2011 |  | 1,500 × 967 (214 KB) | Little Mountain 5 | Sorry, Buffalo | |
| 00:13, 13 September 2011 |  | 1,500 × 967 (212 KB) | Little Mountain 5 | Update with 2010 Census results, darken background for better text visibility, other minor fixes | |
| 19:36, 19 August 2010 |  | 1,500 × 975 (61 KB) | Little Mountain 5 | Add missing San Francisco label | |
| 18:06, 18 August 2010 |  | 1,500 × 975 (60 KB) | Little Mountain 5 | Fix Salem (MA, not RI); label Sun Belt and Rust Belt. | |
| 23:55, 17 August 2010 |  | 1,500 × 975 (40 KB) | Little Mountain 5 | Move Detroit's label | |
| 23:48, 17 August 2010 |  | 1,500 × 975 (40 KB) | Little Mountain 5 | Move labels from legend to their corresponding lines. | |
| 14:40, 17 August 2010 |  | 1,500 × 975 (43 KB) | Little Mountain 5 | Logarithmic scale | |
| 16:16, 16 August 2010 |  | 1,500 × 975 (32 KB) | Little Mountain 5 | {{Information |Description={{en|1=A graph of the populations of all cities that have been in the top 10 in the US by decade.}} |Source={{own}} |Author=[[User:Little Mountain 5|Little Mounta |
File usage
The following pages on the English Wikipedia use this file (pages on other projects are not listed):
Global file usage
The following other wikis use this file:
- Usage on pnb.wikipedia.org
- Usage on ru.wikipedia.org
- Usage on ur.wikipedia.org