
File:Little Ice Age and Sunspots.png

Size of this preview: 800 × 600 pixels. Other resolutions: 320 × 240 pixels | 640 × 480 pixels | 1,024 × 768 pixels | 1,280 × 960 pixels | 2,560 × 1,920 pixels | 3,500 × 2,625 pixels.
Original file (3,500 × 2,625 pixels, file size: 544 KB, MIME type: image/png)
| This is a file from the Wikimedia Commons. Information from its description page there is shown below. Commons is a freely licensed media file repository. You can help. |
Summary
| Description |
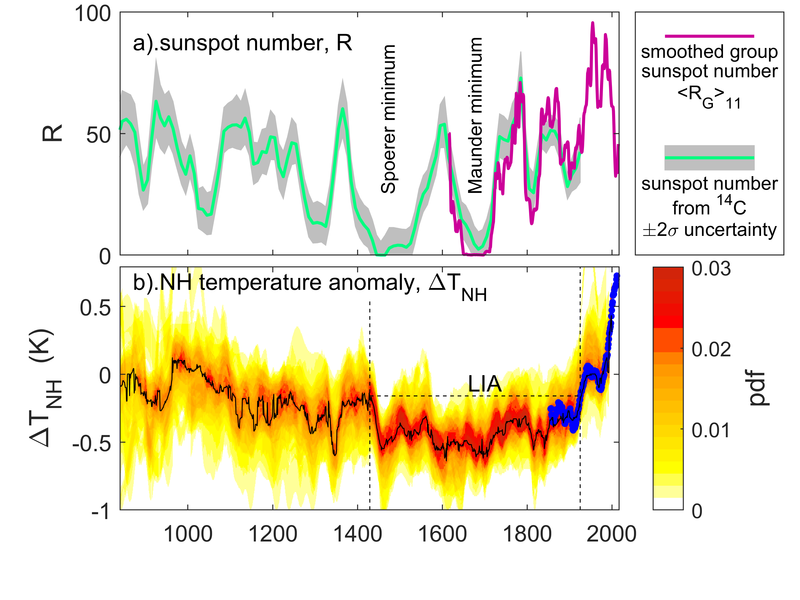
English: Upper panel shows 11-year smoothed group sunspot numbers from telescopic obserations and the sunspot number derived from Carbon-14 cosmogenic isotope abundances in tree trunks. The lower panel shows the northern hemisphere (NH) temperature anomaly (relative to the 1990 level) from a wide variety of paleoclimate proxies: the black line is the mean value, and the colours give the uncertainty probability distribution. The blue dots are the instrumental record. The dashed lines mark the start and end of the Little Ice Age (LIA) defined by the (NH) temperature anomaly level -0.16 degrees Celsius |
| Date | |
| Source | Own work |
| Author | Plot generated by Mike Lockwood from publically-available data |
| Permission (Reusing this file) |
Please credit M. Lockwood and cite papers M. Lockwood, M.J. Owens, E. Hawkins, G.S. Jones and I.G. Usoskin Frost fairs, sunspots and the Little Ice Age (2017) Astronomy and Geophysics, 58 (2), 2.17‐2.23, doi: 10.1093/astrogeo/atx057 and M.J. Owens, M. Lockwood, E. Hawkins, I.G. Usoskin, G.S. Jones, L.A. Barnard, A. Schurer, and J. Fasullo (2017) The Maunder Minimum and the Little Ice Age: An update from recent reconstructions and climate simulations, J. Space Weather Space Clim., 7, A33, doi: 10.1051/swsc/2017034 These papers contain full details of the data sources used |
Licensing
I, the copyright holder of this work, hereby publish it under the following license:
This file is licensed under the Creative Commons Attribution-Share Alike 4.0 International license.
- You are free:
- to share – to copy, distribute and transmit the work
- to remix – to adapt the work
- Under the following conditions:
- attribution – You must give appropriate credit, provide a link to the license, and indicate if changes were made. You may do so in any reasonable manner, but not in any way that suggests the licensor endorses you or your use.
- share alike – If you remix, transform, or build upon the material, you must distribute your contributions under the same or compatible license as the original.
File history
Click on a date/time to view the file as it appeared at that time.
| Date/Time | Thumbnail | Dimensions | User | Comment | |
|---|---|---|---|---|---|
| current | 11:38, 5 March 2022 | | 3,500 × 2,625 (544 KB) | MichaelLockwood | Uploaded own work with UploadWizard |
File usage
The following pages on the English Wikipedia use this file (pages on other projects are not listed):
Global file usage
The following other wikis use this file:
- Usage on cs.wikipedia.org