File:Logisticgrowth.png

Page contents not supported in other languages.
This is a file from the Wikimedia Commons
From Wikipedia, the free encyclopedia

Original file(946 × 830 pixels, file size: 26 KB, MIME type: image/png)

Summary

Description
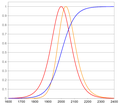
English: Example for a growth projection of the consumption of resources in some imaginary environment. The blue curve is the consumption (logistic function). The red curve is the growth (the 1st derivative of the logistic function) normalized to 1. The orange curve is the growth weighted by the consumption and normalized to 1 as well.
Deutsch: Beispiel für eine Wachstums-Vorhersage für Ressourcen in irgendeiner imaginären Umwelt. Die blaue Kurve stellt den Verbrauch der Ressourcen dar (logistische Funktion ). Die rote Kurve ist das Wachstum (erste Ableitung der logistischen Funktion) des Verbrauchs. Die orange Kurve ist das mit dem Verbrauch gewichtete Wachstum. Alle Kurvebn sind auf 1 normiert.
Date
Source Own work
Author DL5MDA

Licensing

I, the copyright holder of this work, hereby publish it under the following license:
w:en:Creative Commons
attribution
This file is licensed under the Creative Commons Attribution 3.0 Unported license.
You are free:
  • to share – to copy, distribute and transmit the work
  • to remix – to adapt the work
Under the following conditions:
  • attribution – You must give appropriate credit, provide a link to the license, and indicate if changes were made. You may do so in any reasonable manner, but not in any way that suggests the licensor endorses you or your use.

Captions

Add a one-line explanation of what this file represents

Items portrayed in this file

depicts

22 November 2008

File history

Click on a date/time to view the file as it appeared at that time.

Date/TimeThumbnailDimensionsUserComment
current19:47, 22 November 2008Thumbnail for version as of 19:47, 22 November 2008946 × 830 (26 KB)DL5MDA{{Information |Description={{en|1=Example for a growth projection of the consumption of resources in an imaginary environment. The blue curve is the consumption (logistic function). The red curve ist the growth (the 1st derivative of the logistic function
The following pages on the English Wikipedia use this file (pages on other projects are not listed):

Global file usage

The following other wikis use this file: