
File:Pre-term corticosteroid data.svg

Size of this PNG preview of this SVG file: 684 × 309 pixels. Other resolutions: 320 × 145 pixels | 640 × 289 pixels | 1,024 × 463 pixels | 1,280 × 578 pixels | 2,560 × 1,156 pixels.
Original file (SVG file, nominally 684 × 309 pixels, file size: 95 KB)
| This is a file from the Wikimedia Commons. Information from its description page there is shown below. Commons is a freely licensed media file repository. You can help. |
Summary
| Description |
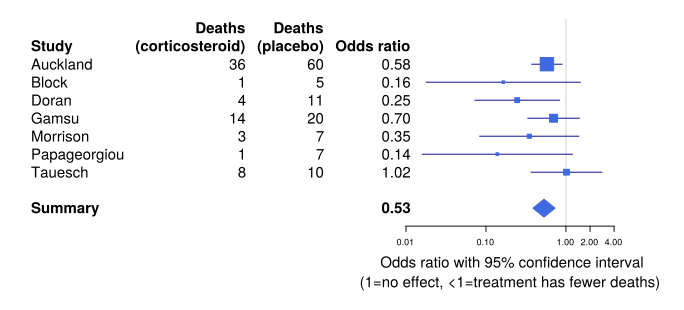
English: This forest plot shows trials of the use of corticosteroids to hasten lung development in pre-term babies. It is an iconic illustration of the power of medical reviews to save lives. The iconic review is from the 1980s, so this plot does not contain all the evidence of the up-to-date version of the same review.
This data is the data from which the logo for Cochrane (organisation) is derived. |
| Date | |
| Source | Source code modified by User:HLHJ from the data and plotting scripts supplied with the GPL-2-licensed software package rmeta (part of the R statistical environment). See rmeta documentation. |
| Author | Thomas Lumley, User:HLHJ |
| SVG development | |
| Source code | R codeinstall.packages("rmeta")
library(rmeta)
data(cochrane)
svg("cochrane_logo_data.svg",width=9,height=4.35)
steroid <- meta.MH(n.trt, n.ctrl, ev.trt, ev.ctrl,
names=name, data=cochrane)
tabletext<-cbind(
c("","Study",steroid$names,NA,"Summary"), #Just tags, not single-author papers
# c("","Year",c(1111,1111,1111,1111,1111,1111,1111),NA,NA), #Don't have this data
c("Deaths","(corticosteroid)",cochrane$ev.trt,NA,NA),
c("Deaths","(placebo)", cochrane$ev.ctrl, NA,NA),
c("","Odds ratio",format(exp(steroid$logOR),digits=2),NA,format(exp(steroid$logMH),digits=2))
)
m<- c(NA,NA,steroid$logOR,NA,steroid$logMH) #Mean
l<- m-c(NA,NA,steroid$selogOR,NA,steroid$selogMH)*2 #Lower
u<- m+c(NA,NA,steroid$selogOR,NA,steroid$selogMH)*2 #Upper
forestplot(tabletext,m,l,u,zero=0,is.summary=c(TRUE,TRUE,rep(FALSE,8),TRUE),
clip=c(log(0.015),log(3)), xlog=TRUE,
xticks=c(0.01,0.1,1,2,4),
col=meta.colors(box="royalblue",line="darkblue", summary="royalblue"))
forestplot(tabletext,m,l,u,zero=0,is.summary=c(TRUE,TRUE,rep(FALSE,8),TRUE),
clip=c(log(0.015),log(3)), xlog=TRUE,
#boxsize=0.75,
xticks=c(0.01,0.1,1,2,4),
xlab="\nOdds ratio with 95% confidence interval\n(1=no effect, <1=treatment has fewer deaths)",
col=meta.colors(box="royalblue",line="darkblue", summary="royalblue"))
dev.off()
|

|
This work is free software; you can redistribute it and/or modify it under the terms of the GNU General Public License as published by the Free Software Foundation; version 2. This work is distributed in the hope that it will be useful, but WITHOUT ANY WARRANTY; without even the implied warranty of MERCHANTABILITY or FITNESS FOR A PARTICULAR PURPOSE. See version 2 of the GNU General Public License for more details. |
File history
Click on a date/time to view the file as it appeared at that time.
| Date/Time | Thumbnail | Dimensions | User | Comment | |
|---|---|---|---|---|---|
| current | 20:00, 21 October 2017 | | 684 × 309 (95 KB) | HLHJ | Took out background and cropped using Inkscape |
| 18:13, 21 October 2017 |  | 810 × 391 (63 KB) | HLHJ | User created page with UploadWizard |
File usage
The following pages on the English Wikipedia use this file (pages on other projects are not listed):
Global file usage
The following other wikis use this file:
- Usage on fr.wikipedia.org
- Usage on he.wikipedia.org
- Usage on ja.wikipedia.org
- Usage on pl.wikipedia.org
- Usage on zh.wikipedia.org