
File:Pressure topography plot during a normal swallow, measured using a 36-channel high-resolution manometry system.jpg
Size of this preview: 703 × 600 pixels. Other resolutions: 281 × 240 pixels | 563 × 480 pixels | 900 × 768 pixels | 1,061 × 905 pixels.
Original file (1,061 × 905 pixels, file size: 119 KB, MIME type: image/jpeg)
| This is a file from the Wikimedia Commons. Information from its description page there is shown below. Commons is a freely licensed media file repository. You can help. |
Summary
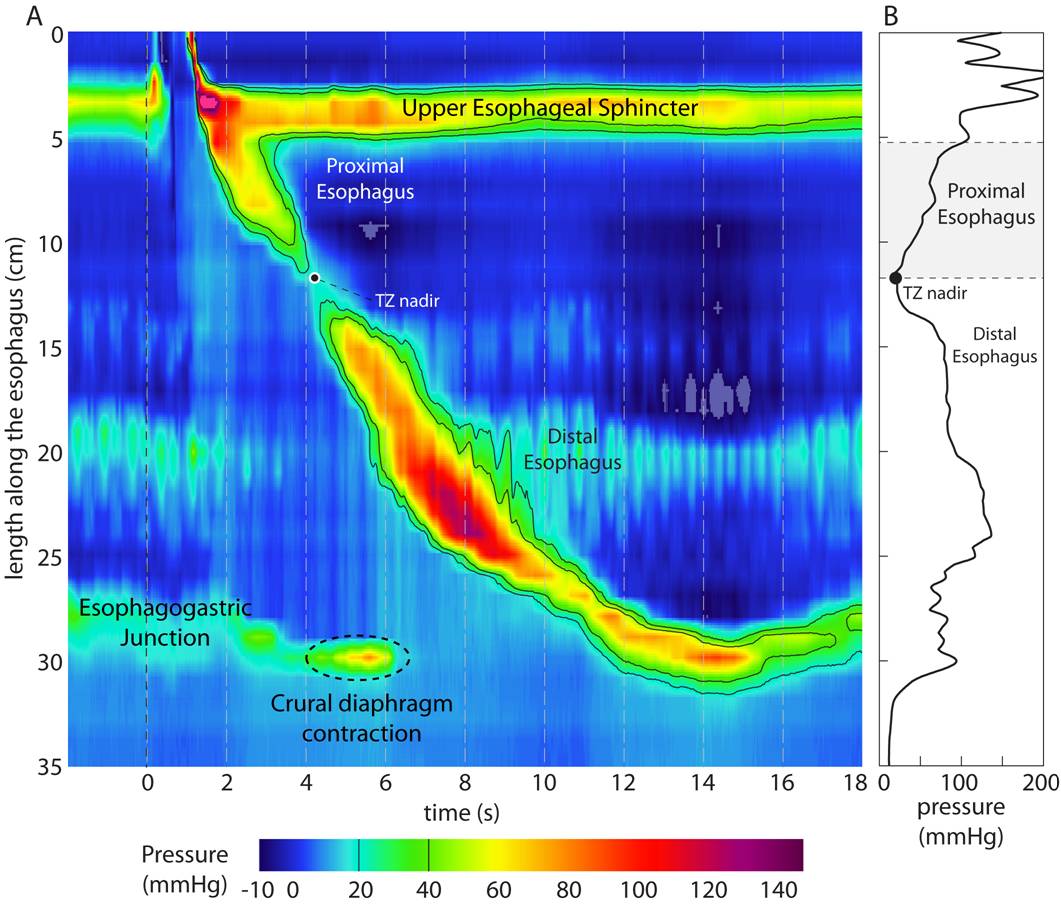
| Description | This figure shows a pressure topography plot during a normal swallow, measured using a 36-channel high-resolution manometry system. Time is on the horizontal axis and length along the esophagus on the vertical axis. Pressure magnitude is encoded in color corresponding to the scale shown at the bottom. High-pressure regions are denoted by the red end of the spectrum while the low pressure regions by the blue end of the spectrum. Data collected at The University Hospital, Cincinnati and plotted using MATLAB (The MathWorks Inc., Natick, MA) by Sudip K. Ghosh, PhD (University of Cincinnati) |
| Date | 3 April 2008 (original upload date) |
| Source | No machine-readable source provided. Own work assumed (based on copyright claims). |
| Author | No machine-readable author provided. Skg135~commonswiki assumed (based on copyright claims). |
Licensing
I, the copyright holder of this work, hereby publish it under the following license:
This file is licensed under the Creative Commons Attribution-Share Alike 3.0 Unported license.
- You are free:
- to share – to copy, distribute and transmit the work
- to remix – to adapt the work
- Under the following conditions:
- attribution – You must give appropriate credit, provide a link to the license, and indicate if changes were made. You may do so in any reasonable manner, but not in any way that suggests the licensor endorses you or your use.
- share alike – If you remix, transform, or build upon the material, you must distribute your contributions under the same or compatible license as the original.
File history
Click on a date/time to view the file as it appeared at that time.
| Date/Time | Thumbnail | Dimensions | User | Comment | |
|---|---|---|---|---|---|
| current | 18:33, 3 April 2008 | | 1,061 × 905 (119 KB) | Skg135~commonswiki | This figure shows a pressure topography plot during a normal swallow, measured using a 36-channel high-resolution manometry system. Time is on the horizontal axis and length along the esophagus on the vertical axis. Pressure magnitude is encoded in colo |
File usage
The following pages on the English Wikipedia use this file (pages on other projects are not listed):
Global file usage
The following other wikis use this file:
- Usage on sr.wikipedia.org