
File:Sina plot ver1.png
Size of this preview: 800 × 527 pixels. Other resolutions: 320 × 211 pixels | 640 × 421 pixels | 1,024 × 674 pixels | 1,280 × 843 pixels | 1,700 × 1,119 pixels.
Original file (1,700 × 1,119 pixels, file size: 363 KB, MIME type: image/png)
| This is a file from the Wikimedia Commons. Information from its description page there is shown below. Commons is a freely licensed media file repository. You can help. |
Summary
| Description |
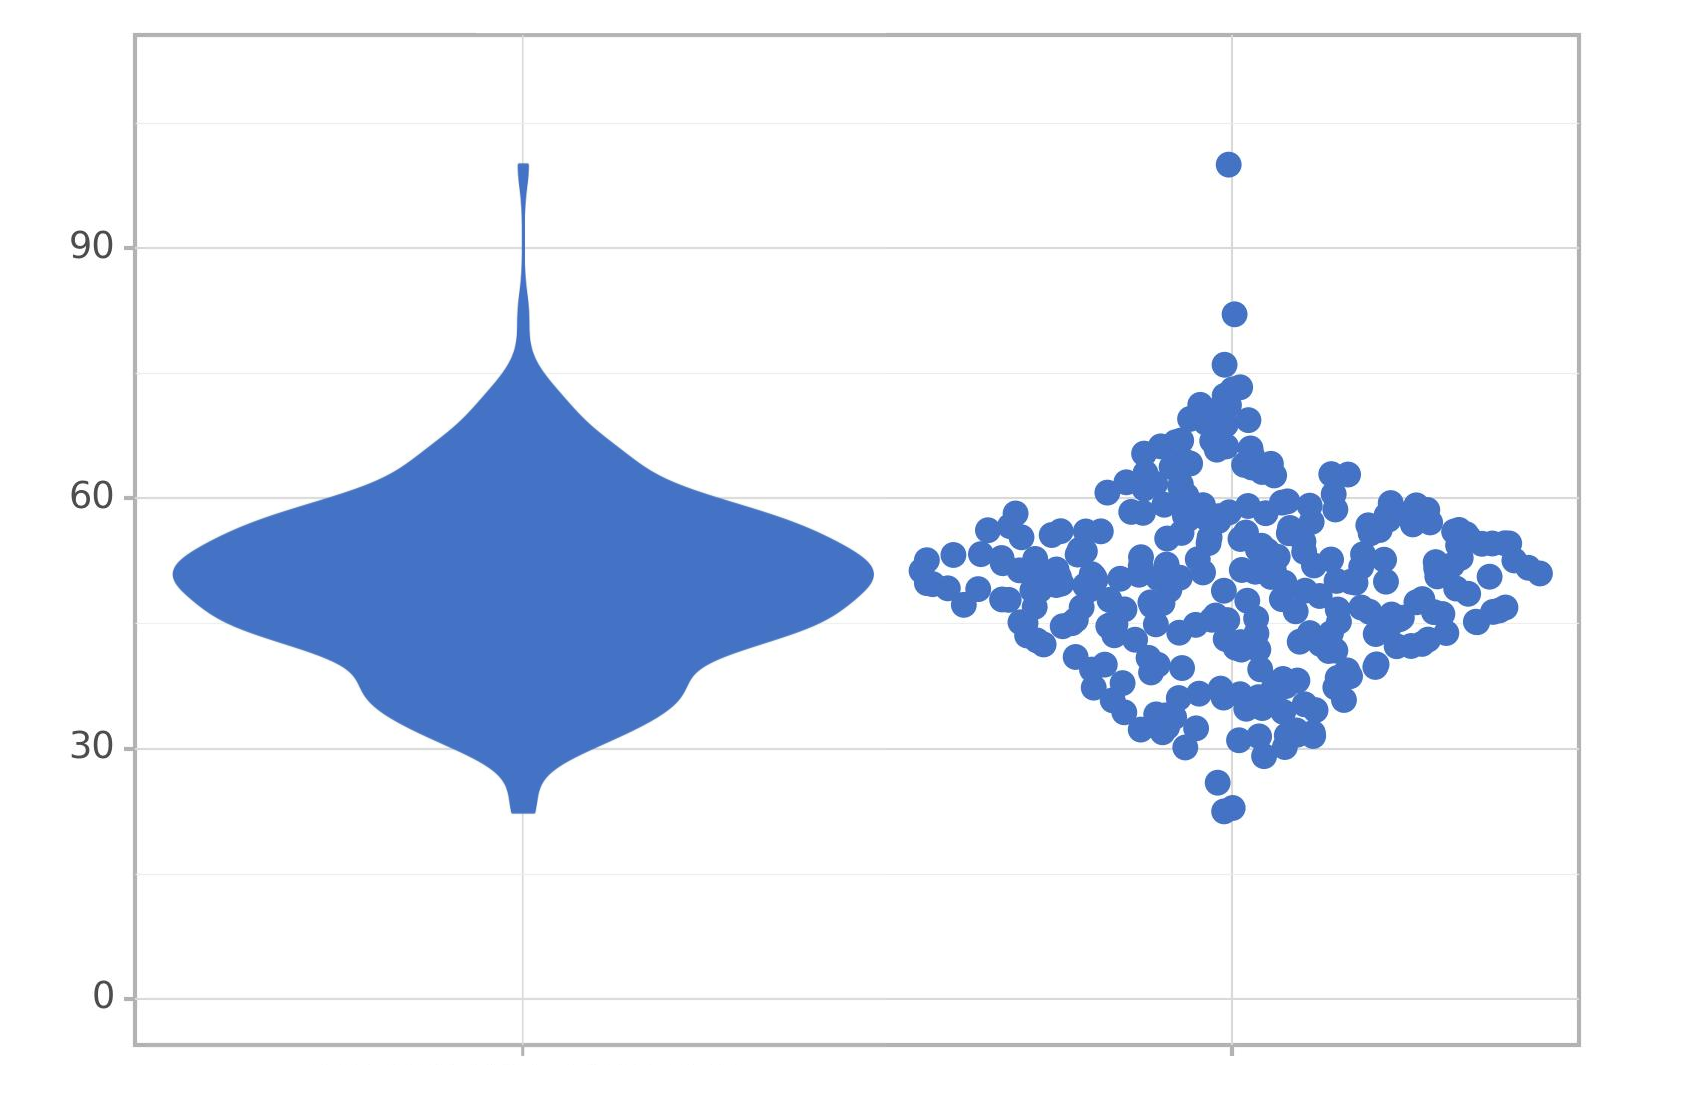
English: A violin plot (on the left) and a sina plot (on the right) drawn using the Plotnine library of Python. The two plots depict the same sample. The sample consists of 301 points:
1) 300 points from a Gaussian distribution (center at 50, standard deviation is 10). 2) 1 point at 100, which represents an outlier. |
| Date | |
| Source | Own work |
| Author | Mike Shelk |
Licensing
I, the copyright holder of this work, hereby publish it under the following license:
This file is licensed under the Creative Commons Attribution-Share Alike 4.0 International license.
- You are free:
- to share – to copy, distribute and transmit the work
- to remix – to adapt the work
- Under the following conditions:
- attribution – You must give appropriate credit, provide a link to the license, and indicate if changes were made. You may do so in any reasonable manner, but not in any way that suggests the licensor endorses you or your use.
- share alike – If you remix, transform, or build upon the material, you must distribute your contributions under the same or compatible license as the original.

|
This media file is uncategorized.
Please help improve this media file by adding it to one or more categories, so it may be associated with related media files (how?), and so that it can be more easily found.
Please notify the uploader with {{subst:Please link images|File:Sina plot ver1.png}} ~~~~ |
File history
Click on a date/time to view the file as it appeared at that time.
| Date/Time | Thumbnail | Dimensions | User | Comment | |
|---|---|---|---|---|---|
| current | 14:28, 18 November 2023 | | 1,700 × 1,119 (363 KB) | Mike Shelk | Uploaded while editing "Draft:Sina plot" on en.wikipedia.org |
File usage
The following pages on the English Wikipedia use this file (pages on other projects are not listed):