
File:Structured program patterns.svg

Size of this PNG preview of this SVG file: 800 × 134 pixels. Other resolutions: 320 × 54 pixels | 640 × 107 pixels | 1,024 × 171 pixels | 1,280 × 214 pixels | 2,560 × 428 pixels | 1,034 × 173 pixels.
Original file (SVG file, nominally 1,034 × 173 pixels, file size: 47 KB)
| This is a file from the Wikimedia Commons. Information from its description page there is shown below. Commons is a freely licensed media file repository. You can help. |
Summary
| Description |
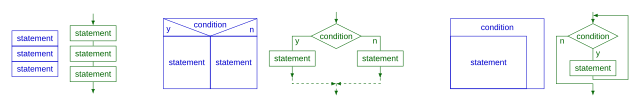
English: Based on https://commons.wikimedia.org/wiki/File:Structured_program_patterns.png
This vector image was created with Vim. |
| Source code | SVG code% lualatex file.tex
% inkscape --export-plain-svg --export-filename=file.svg file.pdf
\documentclass[border=0.5cm]{standalone}
\usepackage{fontspec}
\setmainfont{Liberation Sans}
\usepackage[svgnames]{xcolor}
\usepackage{tikz}
\usetikzlibrary{positioning}
\usetikzlibrary{calc}
\usetikzlibrary{arrows.meta}
\usetikzlibrary{shapes.geometric}
\tikzset{every picture/.style={
semithick,
baseline=(current bounding box.center)
}
\def\st{statement}
\begin{document}
\begin{tikzpicture}[
MediumBlue,
every node/.style={draw, rectangle, inner sep=6pt, outer sep=0},
]
\node (M) {\st};
\node[above=0 of M] {\st};
\node[below=0 of M] {\st};
\end{tikzpicture}%
\hspace{0.5cm}%
\begin{tikzpicture}[
DarkGreen,
every node/.style={draw, rectangle, inner sep=6pt},
]
\node (M) at (0,0) {\st};
\node[above=0.2cm of M] (T) {\st};
\node[below=0.2cm of M] (B) {\st};
\draw[-Latex] (T.north) + (0, 0.5) -> (T.north);
\draw (T.south) -> (M.north);
\draw (M.south) -> (B.north);
\draw[-Latex] (B.south) -> +(0, -0.5);
\end{tikzpicture}%
\hspace{2cm}%
\begin{tikzpicture}[MediumBlue]
\coordinate (TRC) at (4, 0.75);
\draw (0,0) rectangle (4, 0.75);
\draw (0,-2.25) rectangle (2,0);
\draw (2,-2.25) rectangle (4,0);
\draw (0,0.75) -- (2,0);
\draw (4,0.75) -- (2,0);
\node at (2, 0.5) {condition};
\node at (1, -1.125) {\st};
\node at (3, -1.125) {\st};
\node[anchor=south west, minimum height=0.5cm] at (0,0) {y};
\node[anchor=south east, minimum height=0.5cm] at (4,0) {n};
\end{tikzpicture}%
\hspace{0.5cm}%
\begin{tikzpicture}[DarkGreen]
\node[draw, diamond, aspect=2, inner sep=1pt, outer sep=0] (C) {condition};
\node[draw, rectangle, below left=0.5 of C, inner sep=6pt] (Y) {\st};
\node[draw, rectangle, below right=0.5 of C, inner sep=6pt] (N) {\st};
\coordinate (F) at ($(C.south) + (0,-1.5)$);
\draw[-Latex] (C.north) + (0, 0.5) -> (C.north);
\draw (C) -| node[below right] {y} (Y);
\draw (C) -| node[below left] {n} (N);
\draw[-Latex] (Y.south) -> +(0, -0.5);
\draw[-Latex] (N.south) -> +(0, -0.5);
\draw[-Latex, dashed] (Y.south) + (0, -0.5) |- (F);
\draw[-Latex, dashed] (N.south) + (0, -0.5) |- (F);
\draw[-Latex, dashed] (F.south) -> +(0,-0.5);
\end{tikzpicture}%
\hspace{2cm}%
\begin{tikzpicture}[MediumBlue]
\draw (0,0) rectangle (3.25, 2.25);
\draw (0,0) rectangle (4, 3);
\node at (2, 2.635) {condition};
\node at (1.625, 1.125) {\st};
\end{tikzpicture}%
\hspace{0.5cm}%
\begin{tikzpicture}[DarkGreen]
\node[draw, diamond, aspect=2, inner sep=1pt, outer sep=0] (C) {condition};
\node[draw, rectangle, below=0.5 of C, inner sep=6pt] (Y) {\st};
\coordinate (F) at ($(C.south) + (0,-1.5)$);
\draw[-Latex] (C.north) + (0, 0.5) -> (C.north);
\draw (C) -- node[right] {y} (Y);
\draw[-Latex] (C.west) -- node[below] {n} ++(-0.5, 0) |- (F)
-- +(0, -0.5);
\draw[-Latex] (Y.south) |- +(1.5, -0.15) |- ($(C.north) + (0, 0.35)$);
\end{tikzpicture}%
\end{document}
|
| Date | |
| Source | Own work |
| Author | Alnaling |
Licensing
I, the copyright holder of this work, hereby publish it under the following license:
This file is licensed under the Creative Commons Attribution-Share Alike 4.0 International license.
- You are free:
- to share – to copy, distribute and transmit the work
- to remix – to adapt the work
- Under the following conditions:
- attribution – You must give appropriate credit, provide a link to the license, and indicate if changes were made. You may do so in any reasonable manner, but not in any way that suggests the licensor endorses you or your use.
- share alike – If you remix, transform, or build upon the material, you must distribute your contributions under the same or compatible license as the original.
File history
Click on a date/time to view the file as it appeared at that time.
| Date/Time | Thumbnail | Dimensions | User | Comment | |
|---|---|---|---|---|---|
| current | 08:03, 16 July 2023 | 1,034 × 173 (47 KB) | Alnaling | Uploaded own work with UploadWizard |
File usage
The following pages on the English Wikipedia use this file (pages on other projects are not listed):