
File:U.S. States by Vote Distribution, 2016 (Republican Party).svg

Size of this PNG preview of this SVG file: 800 × 527 pixels. Other resolutions: 320 × 211 pixels | 640 × 421 pixels | 1,024 × 674 pixels | 1,280 × 842 pixels | 2,560 × 1,685 pixels | 942 × 620 pixels.
Original file (SVG file, nominally 942 × 620 pixels, file size: 214 KB)
| This is a file from the Wikimedia Commons. Information from its description page there is shown below. Commons is a freely licensed media file repository. You can help. |
Summary
| Description |
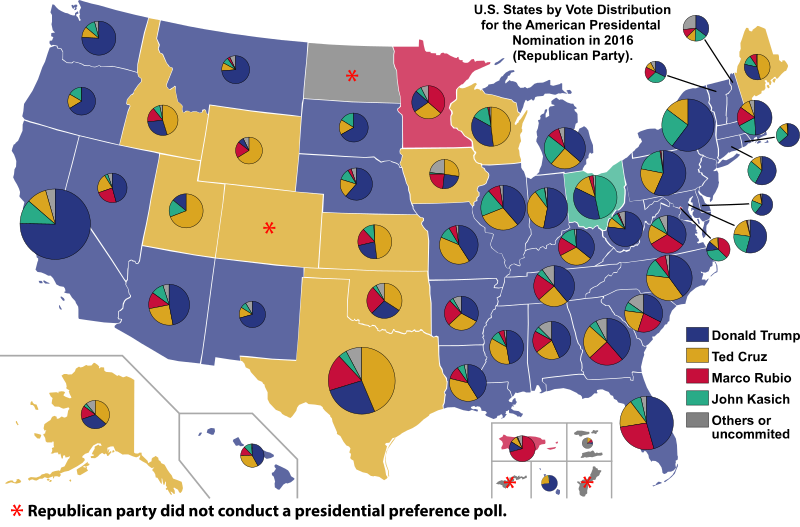
English: U.S. States by Vote Distribution, 2016 (Republican Party). Each state's pie chart is proportional to the number of delegates they have. |
||||||||||||||
| Date | |||||||||||||||
| Source | Own work. Used blank map from here. Data from thegreenpapers.com | ||||||||||||||
| Author | Ali Zifan | ||||||||||||||
| Other versions |
[]
|
.svg)
.svg)


.svg)
.svg)
_by_election_methods,_2016_(Republican_Party).svg)
.svg)


.svg)
.svg)
.svg)


.svg)
.svg)
_by_election_methods,_2016_(Democratic_Party).svg)


.svg)
Licensing
I, the copyright holder of this work, hereby publish it under the following license:
This file is licensed under the Creative Commons Attribution-Share Alike 4.0 International license.
- You are free:
- to share – to copy, distribute and transmit the work
- to remix – to adapt the work
- Under the following conditions:
- attribution – You must give appropriate credit, provide a link to the license, and indicate if changes were made. You may do so in any reasonable manner, but not in any way that suggests the licensor endorses you or your use.
- share alike – If you remix, transform, or build upon the material, you must distribute your contributions under the same or compatible license as the original.
File history
Click on a date/time to view the file as it appeared at that time.
.svg&dir=prev)
.svg&offset=20160323231106)
.svg&offset=&limit=20)
.svg&offset=&limit=50)
.svg&offset=&limit=100)
.svg&offset=&limit=250)
.svg&offset=&limit=500)
| Date/Time | Thumbnail | Dimensions | User | Comment | |
|---|---|---|---|---|---|
| current | 04:44, 14 June 2016 | | 942 × 620 (214 KB) | Oganesson007 | Final results |
| 15:57, 8 June 2016 |  | 959 × 593 (132 KB) | Spiffy sperry | shading for five June primaries (no pie charts) | |
| 19:18, 26 May 2016 |  | 959 × 593 (132 KB) | Spiffy sperry | shading for five May primaries (no pie charts) | |
| 02:15, 2 May 2016 |  | 959 × 593 (132 KB) | Oganesson007 | fixed some errors | |
| 03:24, 30 April 2016 |  | 959 × 593 (219 KB) | Oganesson007 | Made pie charts propotional to delegates | |
| 03:21, 10 April 2016 |  | 959 × 593 (125 KB) | Oganesson007 | Wisconsin | |
| 03:16, 10 April 2016 |  | 959 × 593 (124 KB) | Oganesson007 | Not yet | |
| 05:09, 9 April 2016 |  | 959 × 593 (124 KB) | Jvikings1 | Added fill for a few states | |
| 04:55, 29 March 2016 |  | 959 × 593 (124 KB) | Oganesson007 | Udated AZ for Rubio. Even though he dropped out his popular vote percentage should be indicated because there is a color for him in the map!... | |
| 23:11, 23 March 2016 |  | 959 × 593 (123 KB) | Oganesson007 | Update Utah and Arizona |
File usage
The following pages on the English Wikipedia use this file (pages on other projects are not listed):
Global file usage
The following other wikis use this file:
- Usage on es.wikipedia.org
- Usage on fa.wikipedia.org
- Usage on pt.wikipedia.org
- Usage on ru.wikipedia.org
- Usage on sk.wikipedia.org
.svg)