
File:USA annual VMT vs deaths per VMT.png

Size of this preview: 800 × 560 pixels. Other resolutions: 320 × 224 pixels | 640 × 448 pixels | 1,024 × 716 pixels | 1,280 × 895 pixels | 1,764 × 1,234 pixels.
Original file (1,764 × 1,234 pixels, file size: 113 KB, MIME type: image/png)
| This is a file from the Wikimedia Commons. Information from its description page there is shown below. Commons is a freely licensed media file repository. You can help. |
Summary
| Description |
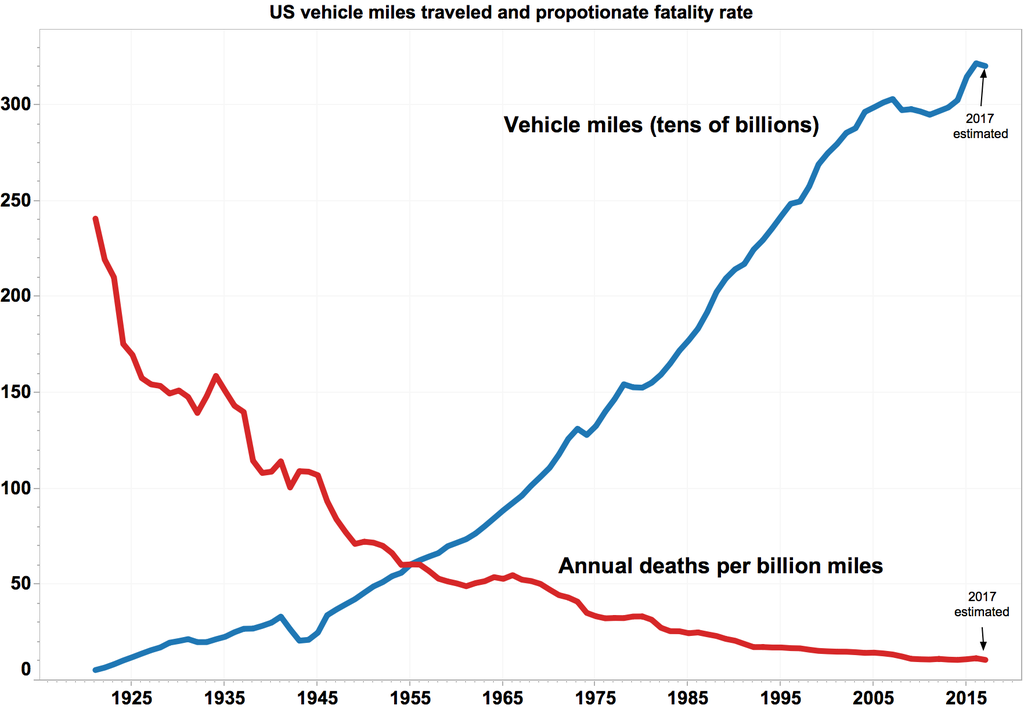
English: Line graph of United States annual traffic deaths per billion vehicle miles traveled (VMT) vs. annual VMT (billions). Sources:
https://www.census.gov/popest/archives/1990s/popclockest.txt https://www.census.gov/popest/archives/2000s/vintage_2002/NA-EST2002-06.html http://www-fars.nhtsa.dot.gov/Main/index.aspx http://www-nrd.nhtsa.dot.gov/Pubs/811493.pdf Created with Tableau |
| Date | |
| Source | Own work |
| Author | Dennis Bratland |

|
This graph image could be re-created using vector graphics as an SVG file. This has several advantages; see Commons:Media for cleanup for more information. If an SVG form of this image is available, please upload it and afterwards replace this template with
{{vector version available|new image name}}.
It is recommended to name the SVG file “USA annual VMT vs deaths per VMT.svg”—then the template Vector version available (or Vva) does not need the new image name parameter. |
Licensing
I, the copyright holder of this work, hereby publish it under the following license:
This file is licensed under the Creative Commons Attribution-Share Alike 3.0 Unported license.
- You are free:
- to share – to copy, distribute and transmit the work
- to remix – to adapt the work
- Under the following conditions:
- attribution – You must give appropriate credit, provide a link to the license, and indicate if changes were made. You may do so in any reasonable manner, but not in any way that suggests the licensor endorses you or your use.
- share alike – If you remix, transform, or build upon the material, you must distribute your contributions under the same or compatible license as the original.
File history
Click on a date/time to view the file as it appeared at that time.
| Date/Time | Thumbnail | Dimensions | User | Comment | |
|---|---|---|---|---|---|
| current | 22:13, 4 January 2018 | | 1,764 × 1,234 (113 KB) | Dennis Bratland | Updated with 2016 and estimated 2017 data |
| 19:50, 8 November 2016 |  | 1,964 × 1,234 (109 KB) | Dennis Bratland | Updated through 2015 | |
| 23:00, 24 December 2014 |  | 1,638 × 1,153 (82 KB) | Dennis Bratland | Extend data out to 2012 | |
| 20:42, 24 December 2014 |  | 1,579 × 1,055 (64 KB) | Dennis Bratland | Reverted to version as of 04:35, 18 May 2014 | |
| 20:38, 24 December 2014 |  | 1,579 × 1,055 (37 KB) | Cherkash | Reverted to version as of 00:29, 18 May 2014: it has longer time series, and grid is actually more helpful in reading individual values than a simple white background | |
| 04:35, 18 May 2014 |  | 1,579 × 1,055 (64 KB) | Dennis Bratland | Reverted to version as of 18:12, 23 October 2011 excessive chartjunk distracting, unhelpful. please use separate file or discuss | |
| 00:29, 18 May 2014 |  | 1,579 × 1,055 (37 KB) | Apteva | spelling | |
| 23:52, 17 May 2014 |  | 1,579 × 1,055 (37 KB) | Apteva | update | |
| 18:12, 23 October 2011 |  | 1,579 × 1,055 (64 KB) | Dennis Bratland |
File usage
The following pages on the English Wikipedia use this file (pages on other projects are not listed):
Global file usage
The following other wikis use this file:
- Usage on fa.wikipedia.org
- Usage on uk.wikipedia.org