
File:Utility maximisation with a budget line.png
Size of this preview: 725 × 600 pixels. Other resolutions: 290 × 240 pixels | 581 × 480 pixels | 994 × 822 pixels.
Original file (994 × 822 pixels, file size: 62 KB, MIME type: image/png)
| This is a file from the Wikimedia Commons. Information from its description page there is shown below. Commons is a freely licensed media file repository. You can help. |
Summary
| Description |
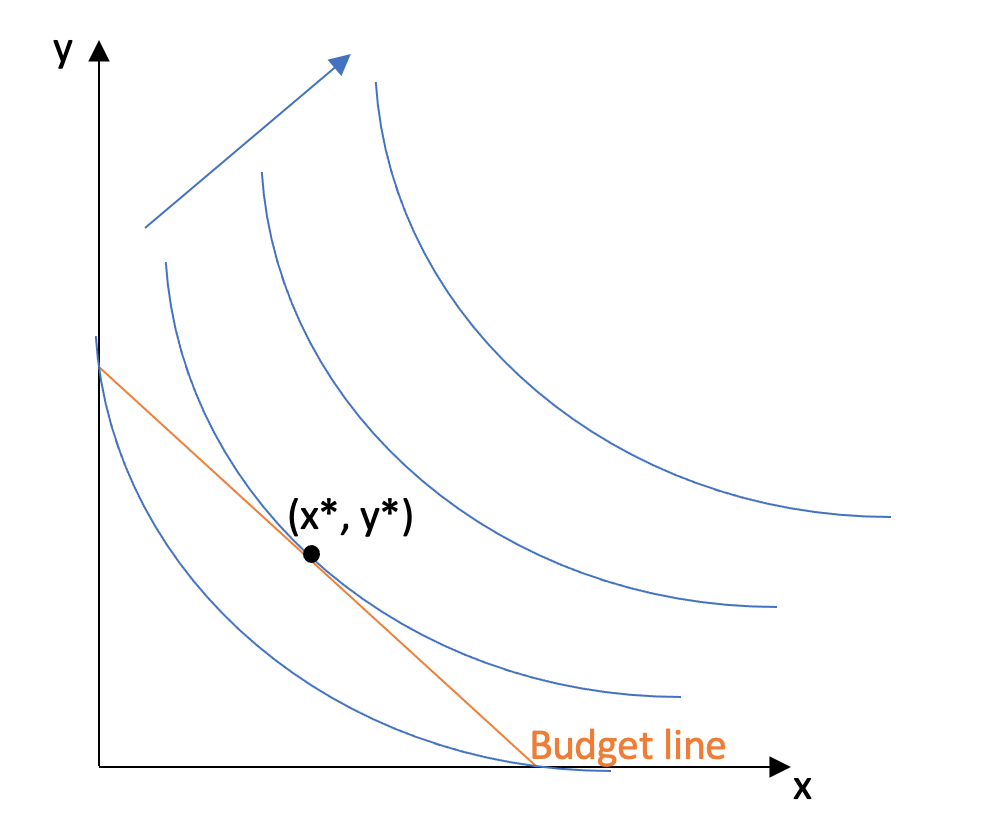
English: This is a graph of two goods (good x and good y), the indifference curves of this consumer increase in utility to the right, and their budget constraint is highlighted in orange. To maximize utility the consumer should consume x* and y* where the slope of the budget line and indifference curves are the same (tangency condition). |
| Date | |
| Source | Own work |
| Author | Cromwellecon |
Licensing
I, the copyright holder of this work, hereby publish it under the following license:
This file is licensed under the Creative Commons Attribution-Share Alike 4.0 International license.
- You are free:
- to share – to copy, distribute and transmit the work
- to remix – to adapt the work
- Under the following conditions:
- attribution – You must give appropriate credit, provide a link to the license, and indicate if changes were made. You may do so in any reasonable manner, but not in any way that suggests the licensor endorses you or your use.
- share alike – If you remix, transform, or build upon the material, you must distribute your contributions under the same or compatible license as the original.

|
This media file is uncategorized.
Please help improve this media file by adding it to one or more categories, so it may be associated with related media files (how?), and so that it can be more easily found.
Please notify the uploader with {{subst:Please link images|File:Utility maximisation with a budget line.png}} ~~~~ |
File history
Click on a date/time to view the file as it appeared at that time.
| Date/Time | Thumbnail | Dimensions | User | Comment | |
|---|---|---|---|---|---|
| current | 23:16, 22 April 2021 | | 994 × 822 (62 KB) | Cromwellecon | Uploaded own work with UploadWizard |
File usage
The following pages on the English Wikipedia use this file (pages on other projects are not listed):