
File:Western Cape 2011 LGE council winners.svg

Size of this PNG preview of this SVG file: 753 × 600 pixels. Other resolutions: 302 × 240 pixels | 603 × 480 pixels | 965 × 768 pixels | 1,280 × 1,019 pixels | 2,560 × 2,038 pixels | 849 × 676 pixels.
Original file (SVG file, nominally 849 × 676 pixels, file size: 419 KB)
| This is a file from the Wikimedia Commons. Information from its description page there is shown below. Commons is a freely licensed media file repository. You can help. |
Summary
| Description |
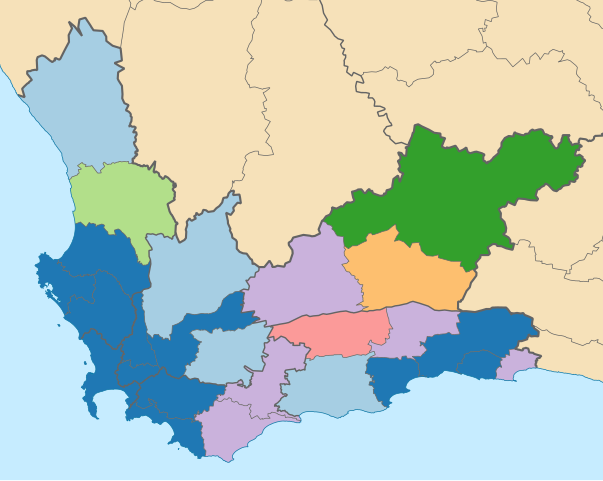
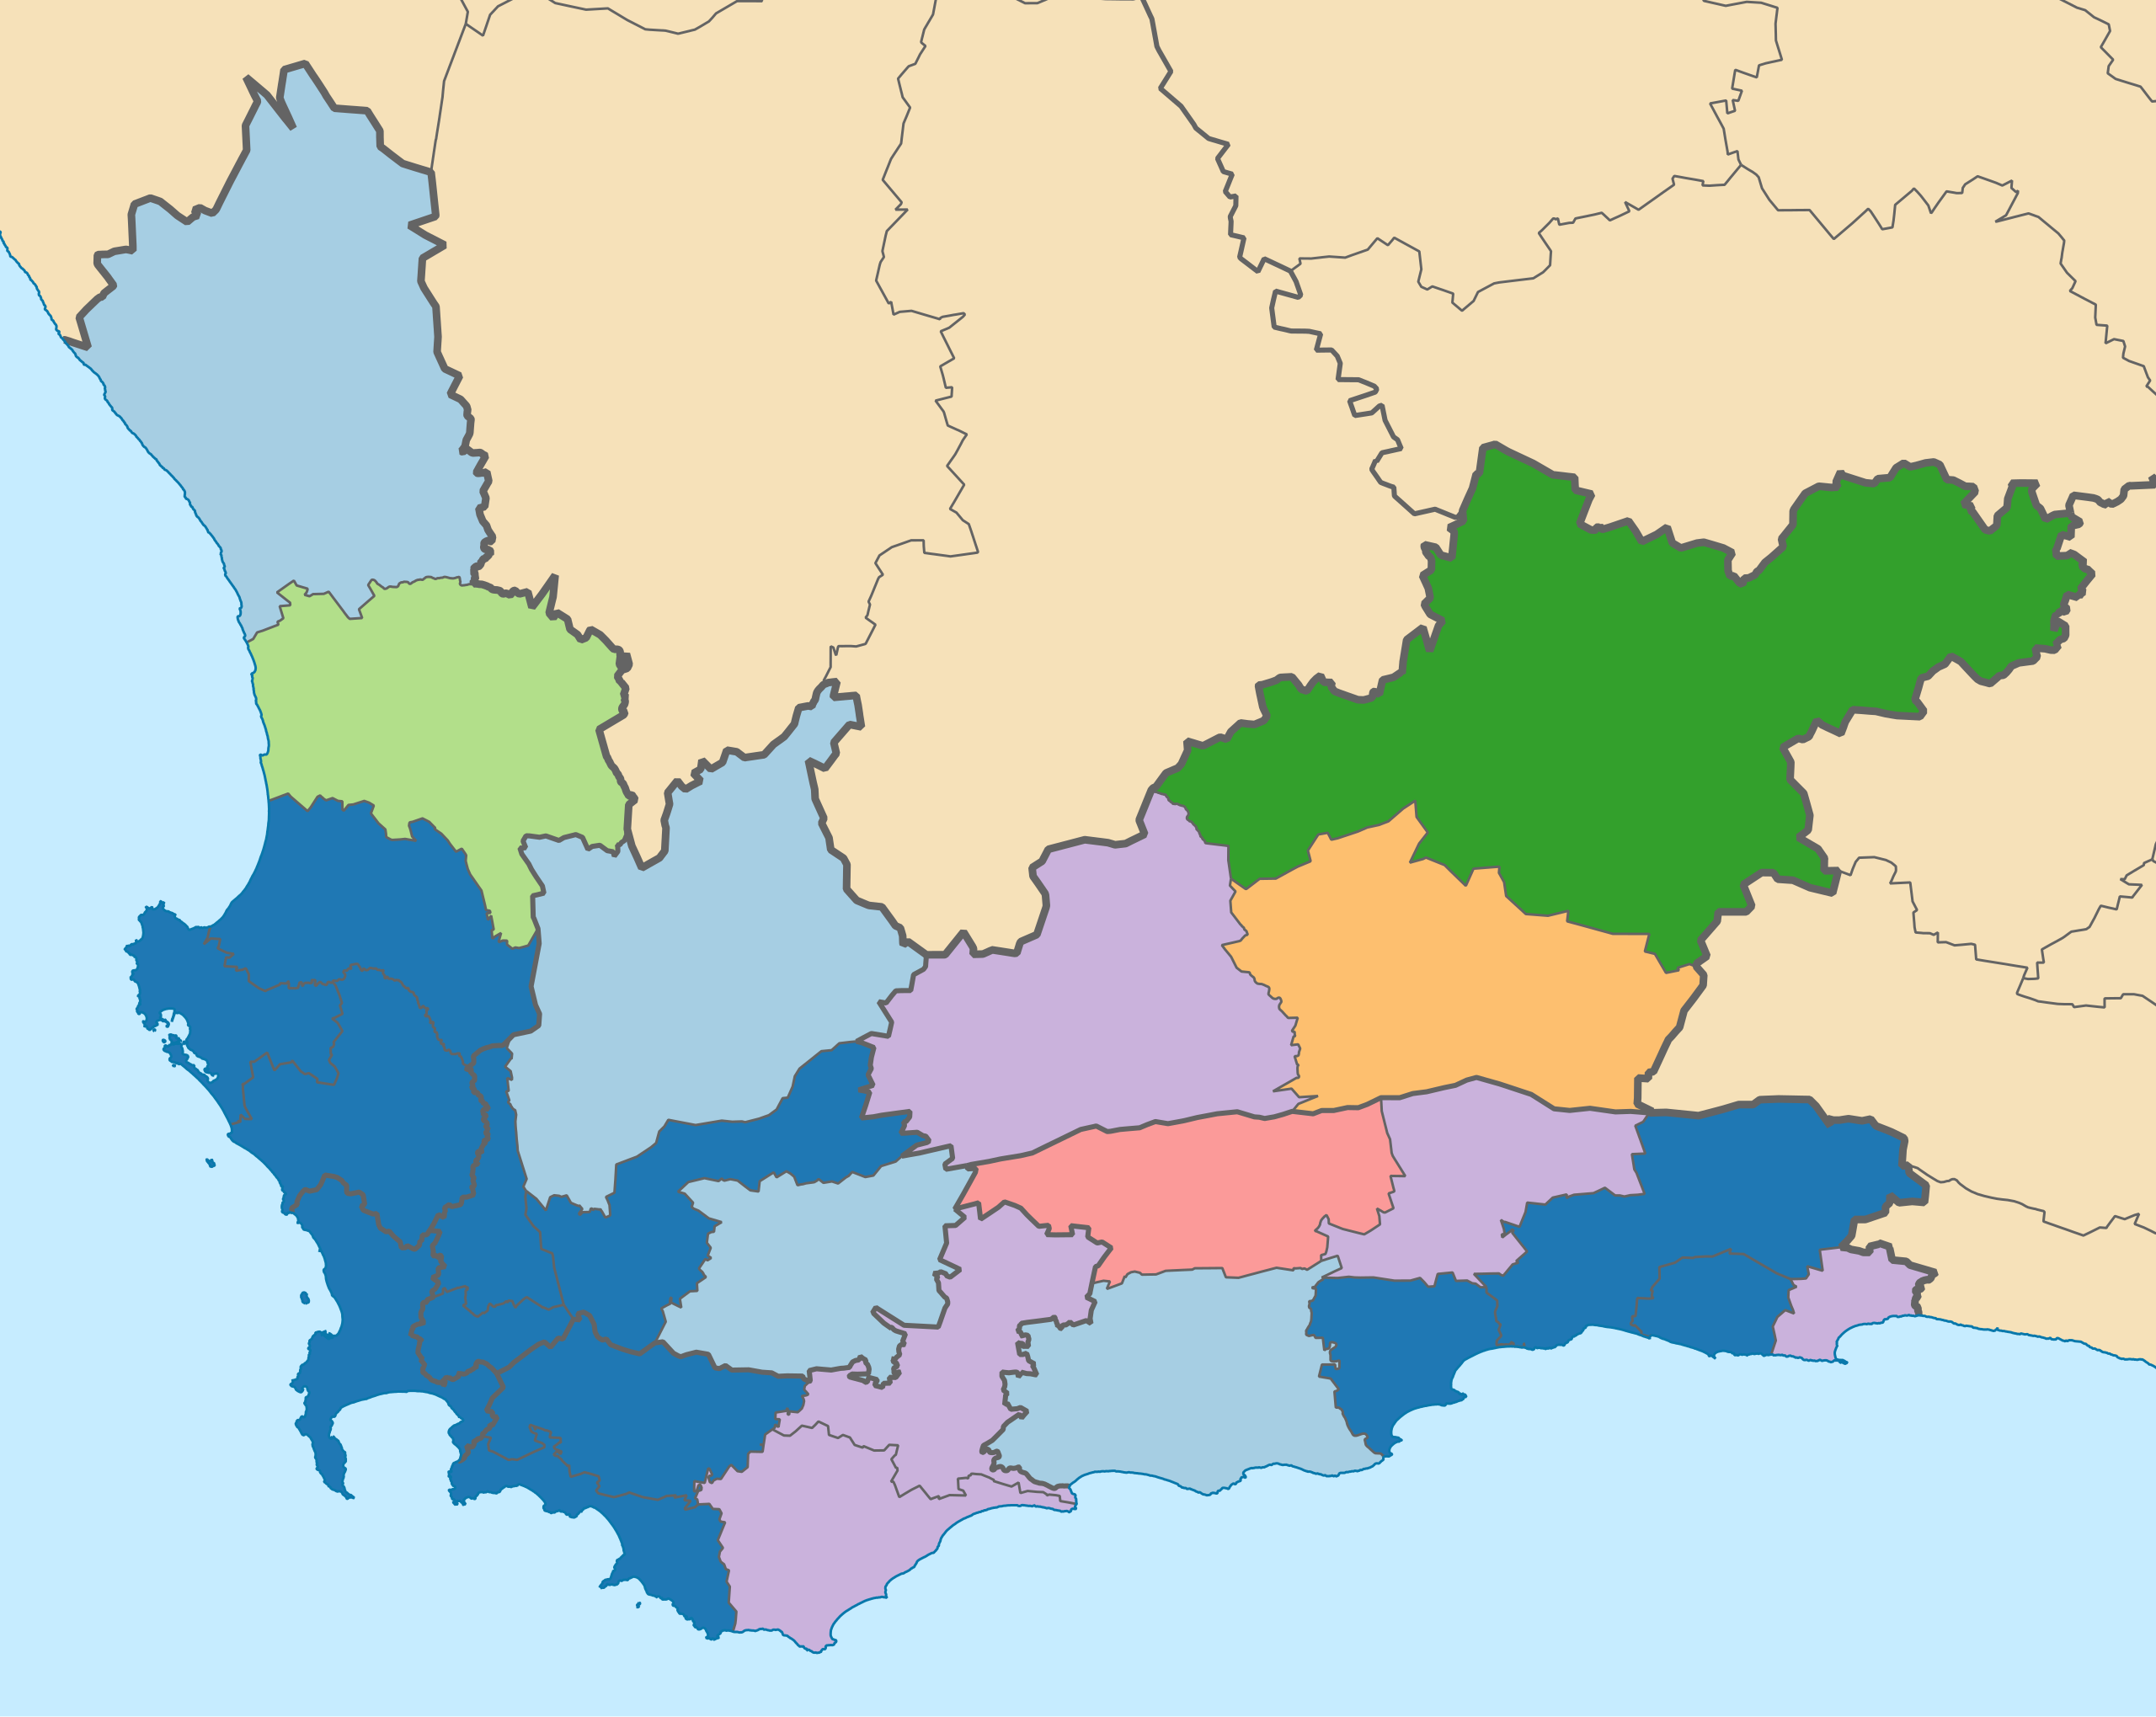
English: Map of the Western Cape, showing for each municipality the state of the council after the elections of 18 May 2011. Note that this is based on actual council seat allocations, not the vote percentages.
DA majority
ANC majority
No majority, DA plurality
No majority, ANC plurality
No majority, ANC/DA tie
No majority, Independent Civic Organisation of SA plurality
No majority, Karoo Gemeenskaps Party plurality |
| Date | |
| Source | Own work, based on File:Map of the Western Cape with municipalities blank (2011).svg |
| Author | Htonl |
.svg)
Licensing
I, the copyright holder of this work, hereby publish it under the following licenses:
This file is licensed under the Creative Commons Attribution-Share Alike 3.0 Unported, 2.5 Generic, 2.0 Generic and 1.0 Generic license.
- You are free:
- to share – to copy, distribute and transmit the work
- to remix – to adapt the work
- Under the following conditions:
- attribution – You must give appropriate credit, provide a link to the license, and indicate if changes were made. You may do so in any reasonable manner, but not in any way that suggests the licensor endorses you or your use.
- share alike – If you remix, transform, or build upon the material, you must distribute your contributions under the same or compatible license as the original.

|
Permission is granted to copy, distribute and/or modify this document under the terms of the GNU Free Documentation License, Version 1.2 or any later version published by the Free Software Foundation; with no Invariant Sections, no Front-Cover Texts, and no Back-Cover Texts. A copy of the license is included in the section entitled GNU Free Documentation License. |
You may select the license of your choice.
File history
Click on a date/time to view the file as it appeared at that time.
| Date/Time | Thumbnail | Dimensions | User | Comment | |
|---|---|---|---|---|---|
| current | 17:23, 21 May 2011 | | 849 × 676 (419 KB) | Htonl | change grey to purple |
| 02:24, 21 May 2011 |  | 849 × 676 (419 KB) | Htonl | DA has won Cape Town | |
| 22:43, 20 May 2011 |  | 849 × 676 (419 KB) | Htonl | tweak grey for ties | |
| 18:35, 19 May 2011 |  | 849 × 676 (419 KB) | Htonl | {{Information |Description ={{en|1=Map of the Western Cape, showing for each municipality the state of the council after the elections of 18 May 2011. Note that this is based on actual council seat allocations, not the vote percentages. {{legend|#1f78b |
File usage
The following pages on the English Wikipedia use this file (pages on other projects are not listed):
Global file usage
The following other wikis use this file:
- Usage on af.wikipedia.org
- Usage on fr.wikipedia.org