
Fisher County, Texas
Fisher County | |
|---|---|
 The Fisher County Courthouse | |
 Location within the U.S. state of Texas | |
 Texas's location within the U.S. | |
| Coordinates: 32°44′N 100°24′W / 32.74°N 100.4°W | |
| Country | |
| State | |
| Founded | 1886 |
| Named for | Samuel Rhoads Fisher |
| Seat | Roby |
| Largest city | Rotan |
| Area | |
| • Total | 902 sq mi (2,340 km2) |
| • Land | 899 sq mi (2,330 km2) |
| • Water | 2.8 sq mi (7 km2) 0.3% |
| Population (2020) | |
| • Total | 3,672 |
| • Density | 4.1/sq mi (1.6/km2) |
| Time zone | UTC−6 (Central) |
| • Summer (DST) | UTC−5 (CDT) |
| Congressional district | 19th |
| Website | www |
Fisher County is a county located in the U.S. state of Texas. As of the 2020 census, its population was 3,672.[1] The county seat is Roby.[2] The county was created in 1876 and later organized in 1886.[3] It is named for Samuel Rhoads Fisher,[4] a signer of the Texas Declaration of Independence and a Secretary of the Navy of the Republic of Texas. Fisher County was one of 30[5] prohibition, or entirely dry, counties in Texas, but is now a fully wet county.
History[edit]
- 10000 BC - Paleo-Indians were the first inhabitants. Later Native American inhabitants include the Pawnee, Wichita and Waco, Lipan Apache, Kiowa, and Comanche.[6]
- 1876 - The Texas legislature formed Fisher County from Bexar districts. The new county was named after Samuel Rhoads Fisher.[6]
- 1880 - The census reported 136 inhabitants.[6]
- 1881 - The Texas and Pacific Railway routed an east–west branch through Eskota.[7]
- 1885 - The town of Fisher was registered. Swedish immigrants founded the community of Swedonia.[8]
- 1886 - The town of North Roby was registered. Roby eventually won the county seat election over Fisher, but one of the voters, a Mr. Bill Purp, was later discovered to have been actually a dog whose owner lived near Roby.[9]
- 1920 - Fisher County was among Texas leaders in wheat production.[6]
- 1926 - Cotton became king, as 48,000 bales were ginned in the county.[6]
- 1928 - Oil was discovered in the county.[6]
- 1970 - The county's average annual farm income was evenly divided between livestock and crops.[6]
Geography[edit]
According to the U.S. Census Bureau, the county has a total area of 902 square miles (2,340 km2), of which 899 square miles (2,330 km2) are land and 2.8 square miles (7.3 km2) (0.3%) is covered by water.[10]
Major highways[edit]
Adjacent counties[edit]
- Stonewall County (north)
- Jones County (east)
- Taylor County (southeast)
- Nolan County (south)
- Mitchell County (southwest)
- Scurry County (west)
- Kent County (northwest)
Demographics[edit]
| Census | Pop. | Note | %± |
|---|---|---|---|
| 1880 | 136 | — | |
| 1890 | 2,996 | 2,102.9% | |
| 1900 | 2,708 | −9.6% | |
| 1910 | 12,596 | 365.1% | |
| 1920 | 11,009 | −12.6% | |
| 1930 | 13,563 | 23.2% | |
| 1940 | 12,932 | −4.7% | |
| 1950 | 11,023 | −14.8% | |
| 1960 | 7,865 | −28.6% | |
| 1970 | 6,344 | −19.3% | |
| 1980 | 5,891 | −7.1% | |
| 1990 | 4,842 | −17.8% | |
| 2000 | 4,344 | −10.3% | |
| 2010 | 3,974 | −8.5% | |
| 2020 | 3,672 | −7.6% | |
| U.S. Decennial Census[11] 1850–2010[12] 2010[13] 2020[14] | |||
| Race / Ethnicity | Pop 2010[13] | Pop 2020[14] | % 2010 | % 2020 |
|---|---|---|---|---|
| White alone (NH) | 2,797 | 2,496 | 70.38% | 67.97% |
| Black or African American alone (NH) | 124 | 92 | 3.12% | 2.51% |
| Native American or Alaska Native alone (NH) | 12 | 15 | 0.30% | 0.41% |
| Asian alone (NH) | 7 | 13 | 0.18% | 0.35% |
| Pacific Islander alone (NH) | 0 | 2 | 0.00% | 0.05% |
| Some Other Race alone (NH) | 7 | 11 | 0.18% | 0.30% |
| Mixed Race/Multi-Racial (NH) | 28 | 70 | 0.70% | 1.91% |
| Hispanic or Latino (any race) | 999 | 973 | 25.14% | 26.50% |
| Total | 3,974 | 3,672 | 100.00% | 100.00% |
Note: the US Census treats Hispanic/Latino as an ethnic category. This table excludes Latinos from the racial categories and assigns them to a separate category. Hispanics/Latinos can be of any race.
As of the census[15] of 2000, 4,344 people, 1,785 households, and 1,244 families resided in the county. The population density was five people per square mile (1.9 people/km2). The 2,277 housing units averaged two units per square mile (0.77 units/km2). The racial makeup of the county was 83.75% White, 2.76% Black or African American, 0.37% Native American, 0.14% Asian, 11.58% from other races, and 1.40% from two or more races. About 21.36% of the population were Hispanic or Latino of any race.
Of the 1,785 households, 27.60% had children under the age of 18 living with them, 58.90% were married couples living together, 8.10% had a female householder with no husband present, and 30.30% were not families. About 28.30% of all households were made up of individuals, and 17.80% had someone living alone who was 65 years of age or older. The average household size was 2.39 and the average family size was 2.93.
In the county, the population was distributed as 23.90% under the age of 18, 6.30% from 18 to 24, 23.00% from 25 to 44, 24.10% from 45 to 64, and 22.70% who were 65 years of age or older. The median age was 43 years. For every 100 females, there were 92.90 males. For every 100 females age 18 and over, there were 89.80 males.
The median income for a household in the county was $27,659, and for a family was $34,907. Males had a median income of $25,071 versus $20,536 for females. The per capita income for the county was $15,120. About 13.50% of families and 17.50% of the population were below the poverty line, including 27.40% of those under age 18 and 10.50% of those age 65 or over.
Communities[edit]
Cities[edit]
- Hamlin (mostly in Jones County)
- Roby (county seat)
- Rotan
Unincorporated communities[edit]
- Hobbs
- Longworth[16] (birthplace of Poker Hall of Fame inductee Doyle Brunson)[17]
- McCauley
- Sylvester
Ghost Towns[edit]
Politics[edit]
Fisher County was one of the last rural yellow dog counties in Texas to switch from consistently voting for Democratic candidates to favoring Republican candidates. From 1921 to 1925, the Democrat Richard M. Chitwood of Sweetwater represented Fisher County in the state House. He left his post to become the first business manager of Texas Tech University, but died the next year.[18]
| Year | Republican | Democratic | Third party | |||
|---|---|---|---|---|---|---|
| No. | % | No. | % | No. | % | |
| 2020 | 1,448 | 79.30% | 352 | 19.28% | 26 | 1.42% |
| 2016 | 1,265 | 73.16% | 403 | 23.31% | 61 | 3.53% |
| 2012 | 1,094 | 67.16% | 512 | 31.43% | 23 | 1.41% |
| 2008 | 1,083 | 60.71% | 687 | 38.51% | 14 | 0.78% |
| 2004 | 1,161 | 60.37% | 758 | 39.42% | 4 | 0.21% |
| 2000 | 968 | 51.71% | 884 | 47.22% | 20 | 1.07% |
| 1996 | 537 | 29.04% | 1,142 | 61.76% | 170 | 9.19% |
| 1992 | 539 | 24.22% | 1,242 | 55.82% | 444 | 19.96% |
| 1988 | 721 | 32.19% | 1,516 | 67.68% | 3 | 0.13% |
| 1984 | 965 | 40.94% | 1,384 | 58.72% | 8 | 0.34% |
| 1980 | 838 | 34.39% | 1,564 | 64.18% | 35 | 1.44% |
| 1976 | 573 | 22.24% | 1,993 | 77.37% | 10 | 0.39% |
| 1972 | 1,207 | 56.22% | 933 | 43.46% | 7 | 0.33% |
| 1968 | 555 | 23.27% | 1,560 | 65.41% | 270 | 11.32% |
| 1964 | 454 | 17.69% | 2,108 | 82.12% | 5 | 0.19% |
| 1960 | 679 | 25.57% | 1,966 | 74.05% | 10 | 0.38% |
| 1956 | 673 | 28.72% | 1,664 | 71.02% | 6 | 0.26% |
| 1952 | 952 | 40.36% | 1,405 | 59.56% | 2 | 0.08% |
| 1948 | 149 | 6.52% | 2,063 | 90.28% | 73 | 3.19% |
| 1944 | 154 | 6.60% | 2,041 | 87.52% | 137 | 5.87% |
| 1940 | 199 | 8.07% | 2,260 | 91.61% | 8 | 0.32% |
| 1936 | 155 | 6.95% | 2,068 | 92.78% | 6 | 0.27% |
| 1932 | 105 | 6.97% | 1,395 | 92.63% | 6 | 0.40% |
| 1928 | 1,259 | 60.07% | 837 | 39.93% | 0 | 0.00% |
| 1924 | 302 | 15.00% | 1,653 | 82.12% | 58 | 2.88% |
| 1920 | 152 | 15.29% | 743 | 74.75% | 99 | 9.96% |
| 1916 | 46 | 3.74% | 950 | 77.17% | 235 | 19.09% |
| 1912 | 21 | 3.48% | 572 | 94.70% | 11 | 1.82% |
See also[edit]
- Dry counties
- Double Mountain Fork Brazos River
- Clear Fork Brazos River
- Salt Fork Brazos River
- National Register of Historic Places listings in Fisher County, Texas
- Recorded Texas Historic Landmarks in Fisher County
References[edit]
- ^ "Fisher County, Texas". United States Census Bureau. Retrieved January 30, 2022.
- ^ "Find a County". National Association of Counties. Archived from the original on May 31, 2011. Retrieved June 7, 2011.
- ^ "Texas: Individual County Chronologies". Texas Atlas of Historical County Boundaries. The Newberry Library. 2008. Archived from the original on April 12, 2017. Retrieved May 23, 2015.
- ^ Gannett, Henry (1905). The Origin of Certain Place Names in the United States. Govt. Print. Off. pp. 126.
- ^ "Wet/Dry Status of Texas Counties as of November 2010". Texas Alcoholic Beverage Commission. Archived from the original on December 11, 2018. Retrieved July 29, 2018.
- ^ a b c d e f g Shelton, Hooper. "Fisher County, Texas". Handbook of Texas Online. Texas State Historical Association. Retrieved December 16, 2010.
- ^ "Eskota, Texas". Texas Escapes. exas Escapes - Blueprints For Travel, LLC. Retrieved December 16, 2010.
- ^ "Swedonia, Texas". Texas Escapes. Texas Escapes - Blueprints For Travel, LLC. Retrieved December 16, 2010.
- ^ "Roby, Texas". Texas Escapes. Texas Escapes - Blueprints For Travel, LLC. Retrieved December 16, 2010.
- ^ "2010 Census Gazetteer Files". United States Census Bureau. August 22, 2012. Retrieved April 26, 2015.
- ^ "Decennial Census of Population and Housing by Decades". US Census Bureau.
- ^ "Texas Almanac: Population History of Counties from 1850–2010" (PDF). Texas Almanac. Archived (PDF) from the original on October 9, 2022. Retrieved April 26, 2015.
- ^ a b "P2 HISPANIC OR LATINO, AND NOT HISPANIC OR LATINO BY RACE - 2010: DEC Redistricting Data (PL 94-171) - Fisher County, Texas". United States Census Bureau.
- ^ a b "P2 HISPANIC OR LATINO, AND NOT HISPANIC OR LATINO BY RACE - 2020: DEC Redistricting Data (PL 94-171) - Fisher County, Texas". United States Census Bureau.
- ^ "U.S. Census website". United States Census Bureau. Retrieved May 14, 2011.
- ^ "Longworth, Texas". Texas Almanac. Texas State Historical Association. Retrieved November 17, 2018.
- ^ Brunson, Doyle (1978). Doyle Brunson's Super System. Las Vegas, Nevada: Cardoza Publishing. ISBN 9781580424752. Retrieved September 4, 2017.
- ^ "Richard M. Chitwood". Texas Legislative Reference Library. Retrieved July 31, 2015.
- ^ Leip, David. "Dave Leip's Atlas of U.S. Presidential Elections". uselectionatlas.org. Retrieved July 22, 2018.
External links[edit]
- Fisher County government's website
- Fisher County from the Handbook of Texas Online
- Fisher County Profile from the Texas Association of Counties Archived June 23, 2015, at the Wayback Machine
Places adjacent to Fisher County, Texas | ||||||||||||||||
|---|---|---|---|---|---|---|---|---|---|---|---|---|---|---|---|---|
| ||||||||||||||||
Municipalities and communities of Fisher County, Texas, United States | ||
|---|---|---|
| Cities | 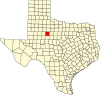 | |
| CDPs | ||
| Other communities | ||
| Ghost towns | ||
| Footnotes | ‡This populated place also has portions in an adjacent county or counties | |
32°44′N 100°24′W / 32.74°N 100.40°W
| International | |
|---|---|
| National | |
| Other | |