
List of municipalities in New Mexico

New Mexico is a state located in the Western United States. According to the 2020 United States Census, New Mexico is the 15th least-populous state with 2,117,522 inhabitants[1] but the 5th-largest by land area, spanning 121,298.15 square miles (314,160.8 km2).[2] New Mexico is divided into 33 counties and contains 106 municipalities consisting of cities, towns, villages and an incorporated county.[3] New Mexico's municipalities cover only 1% of the state's land mass but are home to 65.4% of its population.[2]
All municipalities are granted local government powers including the collection of property tax, funding of fire protection and public transit, providing and maintaining public parks, cemeteries, hospitals, libraries, and museums, building and zoning regulations, and the maintenance of municipal water, sewer, electric, natural gas and solid waste utilities.[4] Municipalities in New Mexico may adopt one of five forms of municipal government including Mayor-Council, Mayor-Council with Manager, Council-Manager, Commission-Manager, or City-County Council-Manager. All municipalities over 10,000 people must elect their representatives by district, with those under 10,000 having option to do so.[5] Citizens in a Mayor-Council form of government elect a mayor (who only votes to break a tie, and does not have veto power), and a council of 4 to 10 councilors or trustees. Any municipality with a population over 1,000 with a Mayor/Council form of government may establish the office of manager who is not elected and administers the hiring and firing of municipal employees, enforces ordinances, prepares the budget, but cannot vote on council.[5] The manager in a Commission/Manager municipality has identical powers to the manager in the Mayor/Council form of government.[5] Mayor-Council system can be changed to a Commission/Manager municipality by popular vote if the population exceeds 3,000. Citizens in a Commission/Manager municipality may also vote on initiatives, referendums and recalls and the mayor has the right to vote on council issues.[5] Only one municipality, Los Alamos, is an incorporated City-County with a Council-Manager system through the Los Alamos County Charter.[6] Municipalities may also adopt a home rule charter which gives local municipalities powers not specifically authorized for municipalities by the state statutes.[5] Twelve municipalities have adopted home rule or a charter in New Mexico.[7]
The largest municipality by population in New Mexico is Albuquerque with 564,559 residents or approximately 26.7% of the state population.[1] The smallest municipality by population is Grenville with 22 residents.[1] The largest municipality by land area is also Albuquerque which spans 187.73 sq mi (486.2 km2), while Virden is the smallest at 0.22 sq mi (0.57 km2).[2]
List of municipalities[edit]
- Largest municipalities in New Mexico by population
-
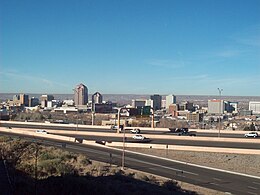 Skyline of Albuquerque, largest municipality in New Mexico
 -
 Las Cruces, second largest municipality in New Mexico
 -
 Aerial view of suburban Rio Rancho, New Mexico's third largest municipality
 -
 Santa Fe, capital and fourth largest municipality of New Mexico
 -
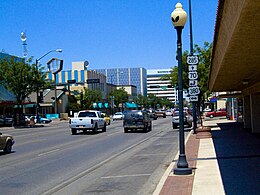 Downtown Roswell, New Mexico's fifth largest municipality


‡ State capital and county seat
§ Home rule or chartered
| Name | Type[2] | Government type[7] | County(ies)[2] | Population (2020)[1] |
Population (2010)[2] |
Change | Land area (2020)[8] |
Population density | |
|---|---|---|---|---|---|---|---|---|---|
| sq mi | km2 | ||||||||
| Alamogordo† | City | Commission–Manager § | Otero | 30,898 | 30,403 | +1.6% | 21.39 | 55.4 | 1,444.5/sq mi (557.7/km2) |
| Albuquerque† | City | Mayor–Council § | Bernalillo | 564,559 | 545,852 | +3.4% | 187.27 | 485.0 | 3,014.7/sq mi (1,164.0/km2) |
| Angel Fire | Village | Mayor–Council | Colfax | 1,192 | 1,216 | −2.0% | 28.81 | 74.6 | 41.4/sq mi (16.0/km2) |
| Anthony[a] | City | Mayor–Council | Doña Ana | 8,693 | 9,360 | −7.1% | 2.70 | 7.0 | 3,219.6/sq mi (1,243.1/km2) |
| Artesia | City | Mayor–Council | Eddy | 12,875 | 11,301 | +13.9% | 11.33 | 29.3 | 1,136.4/sq mi (438.8/km2) |
| Aztec† | City | Commission–Manager | San Juan | 6,201 | 6,763 | −8.3% | 17.06 | 44.2 | 363.5/sq mi (140.3/km2) |
| Bayard | City | Mayor–Council | Grant | 2,116 | 2,328 | −9.1% | 0.95 | 2.5 | 2,227.4/sq mi (860.0/km2) |
| Belen | City | Mayor–Council with Manager | Valencia | 7,360 | 7,269 | +1.3% | 18.96 | 49.1 | 388.2/sq mi (149.9/km2) |
| Bernalillo† | Town | Mayor–Council | Sandoval | 8,977 | 8,320 | +7.9% | 4.89 | 12.7 | 1,835.8/sq mi (708.8/km2) |
| Bloomfield | City | Mayor–Council | San Juan | 7,421 | 8,112 | −8.5% | 18.55 | 48.0 | 400.1/sq mi (154.5/km2) |
| Bosque Farms | Village | Mayor–Council | Valencia | 4,020 | 3,904 | +3.0% | 3.94 | 10.2 | 1,020.3/sq mi (393.9/km2) |
| Capitan | Village | Mayor–Council | Lincoln | 1,391 | 1,489 | −6.6% | 3.26 | 8.4 | 405.2/sq mi (156.5/km2) |
| Carlsbad† | City | Mayor–Council with Manager | Eddy | 32,238 | 26,138 | +23.3% | 31.52 | 81.6 | 1,022.8/sq mi (394.9/km2) |
| Carrizozo† | Town | Mayor–Council | Lincoln | 972 | 996 | −2.4% | 8.36 | 21.7 | 116.3/sq mi (44.9/km2) |
| Causey | Village | Mayor–Council | Roosevelt | 68 | 104 | −34.6% | 3.75 | 9.7 | 18.1/sq mi (7.0/km2) |
| Chama | Village | Mayor–Council | Rio Arriba | 917 | 1,022 | −10.3% | 2.59 | 6.7 | 354.1/sq mi (136.7/km2) |
| Cimarron | Village | Mayor–Council | Colfax | 792 | 1,021 | −22.4% | 2.12 | 5.5 | 373.6/sq mi (144.2/km2) |
| Clayton† | Town | Mayor–Council with Manager | Union | 2,643 | 2,980 | −11.3% | 7.77 | 20.1 | 340.2/sq mi (131.3/km2) |
| Cloudcroft | Village | Mayor–Council | Otero | 750 | 674 | +11.3% | 1.64 | 4.2 | 457.3/sq mi (176.6/km2) |
| Clovis† | City | Commission–Manager § | Curry | 38,567 | 37,775 | +2.1% | 23.63 | 61.2 | 1,632.1/sq mi (630.2/km2) |
| Columbus | Village | Mayor–Council | Luna | 1,442 | 1,664 | −13.3% | 4.67 | 12.1 | 308.8/sq mi (119.2/km2) |
| Corona | Village | Mayor–Council | Lincoln | 129 | 172 | −25.0% | 1.03 | 2.7 | 125.2/sq mi (48.4/km2) |
| Corrales | Village | Mayor–Council | Sandoval | 8,493 | 8,329 | +2.0% | 10.79 | 27.9 | 787.1/sq mi (303.9/km2) |
| Cuba | Village | Mayor–Council | Sandoval | 628 | 731 | −14.1% | 3.26 | 8.4 | 192.6/sq mi (74.4/km2) |
| Deming† | City | Mayor–Council with Manager | Luna | 14,758 | 14,855 | −0.7% | 16.72 | 43.3 | 882.7/sq mi (340.8/km2) |
| Des Moines | Village | Mayor–Council | Union | 117 | 143 | −18.2% | 0.87 | 2.3 | 134.5/sq mi (51.9/km2) |
| Dexter | Town | Mayor–Council | Chaves | 1,074 | 1,266 | −15.2% | 0.73 | 1.9 | 1,471.2/sq mi (568.0/km2) |
| Dora | Village | Mayor–Council | Roosevelt | 117 | 133 | −12.0% | 2.63 | 6.8 | 44.5/sq mi (17.2/km2) |
| Eagle Nest | Village | Mayor–Council | Colfax | 315 | 290 | +8.6% | 4.48 | 11.6 | 70.3/sq mi (27.1/km2) |
| Edgewood | Town | Commission-Manager | Santa Fe | 6,174 | 3,735 | +65.3% | 56.80 | 147.1 | 108.7/sq mi (42.0/km2) |
| Elephant Butte | City | Mayor–Council | Sierra | 1,447 | 1,431 | +1.1% | 4.18 | 10.8 | 346.2/sq mi (133.7/km2) |
| Elida | Town | Mayor–Council | Roosevelt | 166 | 197 | −15.7% | 1.02 | 2.6 | 162.7/sq mi (62.8/km2) |
| Encino | Village | Mayor–Council | Torrance | 51 | 82 | −37.8% | 1.99 | 5.2 | 25.6/sq mi (9.9/km2) |
| Espanola | City | Mayor–Council with Manager | Rio Arriba Santa Fe |
10,526 | 10,224 | +3.0% | 8.22 | 21.3 | 1,280.5/sq mi (494.4/km2) |
| Estancia† | Town | Mayor–Council | Torrance | 1,242 | 1,655 | −25.0% | 6.17 | 16.0 | 201.3/sq mi (77.7/km2) |
| Eunice | City | Mayor–Council | Lea | 3,056 | 2,562 | +19.3% | 4.09 | 10.6 | 747.2/sq mi (288.5/km2) |
| Farmington | City | Mayor–Council with Manager | San Juan | 46,624 | 45,877 | +1.6% | 34.46 | 89.3 | 1,353.0/sq mi (522.4/km2) |
| Floyd | Village | Mayor–Council | Roosevelt | 86 | 133 | −35.3% | 3.05 | 7.9 | 28.2/sq mi (10.9/km2) |
| Folsom | Village | Mayor–Council | Union | 51 | 56 | −8.9% | 0.65 | 1.7 | 78.5/sq mi (30.3/km2) |
| Fort Sumner† | Village | Mayor–Council | De Baca | 889 | 1,031 | −13.8% | 3.32 | 8.6 | 267.8/sq mi (103.4/km2) |
| Gallup† | City | Mayor–Council with Manager § | McKinley | 21,899 | 21,678 | +1.0% | 20.19 | 52.3 | 1,084.6/sq mi (418.8/km2) |
| Grady | Village | Mayor–Council | Curry | 86 | 107 | −19.6% | 0.27 | 0.70 | 318.5/sq mi (123.0/km2) |
| Grants† | City | Mayor–Council with Manager § | Cibola | 9,163 | 9,182 | −0.2% | 14.91 | 38.6 | 614.6/sq mi (237.3/km2) |
| Grenville | Village | Mayor–Council | Union | 22 | 38 | −42.1% | 0.38 | 0.98 | 57.9/sq mi (22.4/km2) |
| Hagerman | Town | Mayor–Council | Chaves | 975 | 1,257 | −22.4% | 1.36 | 3.5 | 716.9/sq mi (276.8/km2) |
| Hatch | Village | Mayor–Council | Doña Ana | 1,539 | 1,648 | −6.6% | 3.01 | 7.8 | 511.3/sq mi (197.4/km2) |
| Hobbs | City | Commission–Manager § | Lea | 40,508 | 34,122 | +18.7% | 26.40 | 68.4 | 1,534.4/sq mi (592.4/km2) |
| Hope | Village | Mayor–Council | Eddy | 113 | 105 | +7.6% | 1.22 | 3.2 | 92.6/sq mi (35.8/km2) |
| House | Village | Mayor–Council | Quay | 56 | 68 | −17.6% | 0.91 | 2.4 | 61.5/sq mi (23.8/km2) |
| Hurley | Town | Mayor–Council | Grant | 1,256 | 1,297 | −3.2% | 1.02 | 2.6 | 1,231.4/sq mi (475.4/km2) |
| Jal | City | Mayor–Council | Lea | 2,202 | 2,047 | +7.6% | 4.82 | 12.5 | 456.8/sq mi (176.4/km2) |
| Jemez Springs | Village | Mayor–Council | Sandoval | 198 | 250 | −20.8% | 4.80 | 12.4 | 41.3/sq mi (15.9/km2) |
| Kirtland[b] | Town | Mayor–Council | San Juan | 585[11] | 1.7 | 4.4[12] | 344.1/sq mi (132.9/km2) | ||
| Lake Arthur | Town | Mayor–Council | Chaves | 378 | 436 | −13.3% | 0.53 | 1.4 | 713.2/sq mi (275.4/km2) |
| Las Cruces† | City | Council–Manager § | Doña Ana | 111,385 | 97,618 | +14.1% | 76.93 | 199.2 | 1,447.9/sq mi (559.0/km2) |
| Las Vegas† | City | Mayor–Council with Manager § | San Miguel | 13,166 | 13,753 | −4.3% | 7.82 | 20.3 | 1,683.6/sq mi (650.1/km2) |
| Logan | Village | Mayor–Council | Quay | 970 | 1,042 | −6.9% | 10.60 | 27.5 | 91.5/sq mi (35.3/km2) |
| Lordsburg† | City | Mayor–Council | Hidalgo | 2,335 | 2,797 | −16.5% | 8.43 | 21.8 | 277.0/sq mi (106.9/km2) |
| Los Alamos | County |
City–County |
Los Alamos | 19,419 | 17,950 | +8.2% | 109.17 | 282.7 | 177.9/sq mi (68.7/km2) |
| Los Lunas† | Village | Mayor–Council | Valencia | 17,242 | 14,835 | +16.2% | 18.73 | 48.5 | 920.6/sq mi (355.4/km2) |
| Los Ranchos de Albuquerque | Village | Mayor–Council | Bernalillo | 5,874 | 6,024 | −2.5% | 4.45 | 11.5 | 1,320.0/sq mi (509.7/km2) |
| Loving | Village | Mayor–Council | Eddy | 1,390 | 1,413 | −1.6% | 1.21 | 3.1 | 1,148.8/sq mi (443.5/km2) |
| Lovington† | City | Commission–Manager | Lea | 11,668 | 11,009 | +6.0% | 11.20 | 29.0 | 1,041.8/sq mi (402.2/km2) |
| Magdalena | Village | Mayor–Council | Socorro | 806 | 938 | −14.1% | 6.22 | 16.1 | 129.6/sq mi (50.0/km2) |
| Maxwell | Village | Mayor–Council | Colfax | 224 | 254 | −11.8% | 0.47 | 1.2 | 476.6/sq mi (184.0/km2) |
| Melrose | Village | Mayor–Council | Curry | 622 | 651 | −4.5% | 1.69 | 4.4 | 368.0/sq mi (142.1/km2) |
| Mesilla | Town | Mayor–Council | Doña Ana | 1,797 | 2,196 | −18.2% | 5.68 | 14.7 | 316.4/sq mi (122.2/km2) |
| Milan | Village | Mayor–Council | Cibola | 2,456 | 3,245 | −24.3% | 4.34 | 11.2 | 565.9/sq mi (218.5/km2) |
| Moriarty | City | Mayor–Council | Torrance | 1,946 | 1,910 | +1.9% | 6.94 | 18.0 | 280.4/sq mi (108.3/km2) |
| Mosquero† | Village | Mayor–Council | Harding San Miguel |
98 | 93 | +5.4% | 1.00 | 2.6 | 98.0/sq mi (37.8/km2) |
| Mountainair | Town | Mayor–Council | Torrance | 884 | 928 | −4.7% | 1.58 | 4.1 | 559.5/sq mi (216.0/km2) |
| Pecos | Village | Mayor–Council | San Miguel | 1,392 | 1,392 | 0.0% | 1.78 | 4.6 | 782.0/sq mi (301.9/km2) |
| Peralta[c] | Town | Mayor–Council | Valencia | 3,342 | 3,660 | −8.7% | 4.44 | 11.5 | 752.7/sq mi (290.6/km2) |
| Portales† | City | Mayor–Council with Manager | Roosevelt | 12,137 | 12,280 | −1.2% | 7.95 | 20.6 | 1,526.7/sq mi (589.4/km2) |
| Questa | Village | Mayor–Council | Taos | 1,742 | 1,770 | −1.6% | 5.11 | 13.2 | 340.9/sq mi (131.6/km2) |
| Raton† | City | Commission–Manager | Colfax | 6,041 | 6,885 | −12.3% | 7.96 | 20.6 | 758.9/sq mi (293.0/km2) |
| Red River | Town | Mayor–Council | Taos | 542 | 477 | +13.6% | 1.02 | 2.6 | 531.4/sq mi (205.2/km2) |
| Reserve† | Village | Mayor–Council | Catron | 293 | 289 | +1.4% | 0.56 | 1.5 | 523.2/sq mi (202.0/km2) |
| Rio Communities[d][15] | City | Mayor–Council | Valencia | 4,926 | 7.7 | 20= | 639.7/sq mi (247.0/km2) | ||
| Rio Rancho | City | Mayor–Council with Manager § | Bernalillo Sandoval |
104,026 | 87,521 | +18.9% | 103.36 | 267.7 | 1,006.4/sq mi (388.6/km2) |
| Roswell† | City | Mayor–Council with Manager | Chaves | 48,422 | 48,366 | +0.1% | 29.72 | 77.0 | 1,629.3/sq mi (629.1/km2) |
| Roy | Village | Mayor–Council | Harding | 193 | 234 | −17.5% | 2.04 | 5.3 | 94.6/sq mi (36.5/km2) |
| Ruidoso | Village | Mayor–Council with Manager | Lincoln | 7,679 | 8,029 | −4.4% | 16.13 | 41.8 | 476.1/sq mi (183.8/km2) |
| Ruidoso Downs | City | Mayor–Council | Lincoln | 2,620 | 2,815 | −6.9% | 3.79 | 9.8 | 691.3/sq mi (266.9/km2) |
| San Jon | Village | Mayor–Council | Quay | 195 | 216 | −9.7% | 2.93 | 7.6 | 66.6/sq mi (25.7/km2) |
| San Ysidro | Village | Mayor–Council | Sandoval | 166 | 193 | −14.0% | 2.34 | 6.1 | 70.9/sq mi (27.4/km2) |
| Santa Clara | Village | Mayor–Council | Grant | 1,637 | 1,686 | −2.9% | 1.99 | 5.2 | 822.6/sq mi (317.6/km2) |
| Santa Fe‡ | City | Mayor–Council with Manager § | Santa Fe | 87,505 | 67,947 | +28.8% | 52.23 | 135.3 | 1,675.4/sq mi (646.9/km2) |
| Santa Rosa† | City | Mayor–Council | Guadalupe | 2,850 | 2,848 | +0.1% | 5.00 | 12.9 | 570.0/sq mi (220.1/km2) |
| Silver City† | Town | Mayor–Council with Manager § | Grant | 9,704 | 10,315 | −5.9% | 10.12 | 26.2 | 958.9/sq mi (370.2/km2) |
| Socorro† | City | Mayor–Council | Socorro | 8,707 | 9,051 | −3.8% | 14.45 | 37.4 | 602.6/sq mi (232.6/km2) |
| Springer | Town | Mayor–Council | Colfax | 931 | 1,047 | −11.1% | 2.20 | 5.7 | 423.2/sq mi (163.4/km2) |
| Sunland Park | City | Mayor–Council | Doña Ana | 16,702 | 14,106 | +18.4% | 13.58 | 35.2 | 1,229.9/sq mi (474.9/km2) |
| Taos† | Town | Mayor–Council with Manager | Taos | 6,474 | 5,716 | +13.3% | 6.02 | 15.6 | 1,075.4/sq mi (415.2/km2) |
| Taos Ski Valley | Village | Mayor–Council | Taos | 77 | 69 | +11.6% | 2.85 | 7.4 | 27.0/sq mi (10.4/km2) |
| Tatum | Town | Mayor–Council | Lea | 706 | 798 | −11.5% | 1.59 | 4.1 | 444.0/sq mi (171.4/km2) |
| Texico | City | Mayor–Council | Curry | 956 | 1,130 | −15.4% | 0.83 | 2.1 | 1,151.8/sq mi (444.7/km2) |
| Tijeras | Village | Mayor–Council | Bernalillo | 465 | 541 | −14.0% | 1.13 | 2.9 | 411.5/sq mi (158.9/km2) |
| Truth or Consequences† | City | Commission–Manager | Sierra | 6,052 | 6,475 | −6.5% | 28.00 | 72.5 | 216.1/sq mi (83.5/km2) |
| Tucumcari† | City | Commission–Manager | Quay | 5,278 | 5,363 | −1.6% | 9.51 | 24.6 | 555.0/sq mi (214.3/km2) |
| Tularosa | Village | Mayor–Council | Otero | 2,553 | 2,842 | −10.2% | 2.82 | 7.3 | 905.3/sq mi (349.5/km2) |
| Vaughn | Town | Mayor–Council | Guadalupe | 286 | 446 | −35.9% | 5.60 | 14.5 | 51.1/sq mi (19.7/km2) |
| Virden | Village | Mayor–Council | Hidalgo | 126 | 152 | −17.1% | 0.21 | 0.54 | 600.0/sq mi (231.7/km2) |
| Wagon Mound | Village | Mayor–Council | Mora | 266 | 314 | −15.3% | 1.01 | 2.6 | 263.4/sq mi (101.7/km2) |
| Willard | Village | Mayor–Council | Torrance | 201 | 253 | −20.6% | 0.92 | 2.4 | 218.5/sq mi (84.4/km2) |
| Williamsburg | Village | Mayor–Council | Sierra | 462 | 449 | +2.9% | 0.49 | 1.3 | 942.9/sq mi (364.0/km2) |
| Total municipalities | – | – | – | 1,446,366 | 1,347,159 | +7.4% | 1,275.58 | 3,303.7 | 1,133.9/sq mi (437.8/km2) |
| New Mexico | – | – | – | 2,117,522 | 2,059,179 | +2.8%[16] | 121,298.15 | 314,160.8 | 17.5/sq mi (6.7/km2) |
See also[edit]
Notes[edit]
- ^ The city incorporated on July 1, 2010, and is thus not represented in the 2010 Census as a city, but only as a census designated place. The populations and area for the Anthony CDP is included here, but not in the totals.[9]
- ^ The town incorporated on January 6, 2015, and is thus not represented in the 2010 Census.[10]
- ^ The town incorporated on July 1, 2007, and is thus not represented in the 2010 Census.[13]
- ^ The city incorporated May 16, 2013, and is thus not represented in the 2010 Census.[14]
References[edit]
- ^ a b c d "U.S. Census Bureau QuickFacts". U.S. Census Bureau. Retrieved August 25, 2021.
- ^ a b c d e f "GCT-PH1 – Population, Housing Units, Area, and Density: 2010 – State – Place and (in selected states) County Subdivision". 2010 United States Census. United States Census Bureau. Archived from the original on February 13, 2020. Retrieved June 17, 2016.
- ^ "Forms of Municipal Government in New Mexico" (PDF). New Mexico Municipal League. 2016. Archived (PDF) from the original on March 26, 2017. Retrieved March 26, 2018.
- ^ "Additional Powers of Any Municipality" (PDF). New Mexico Municipal League. Archived (PDF) from the original on September 15, 2015. Retrieved March 31, 2018.
- ^ a b c d e "Forms of Municipal Government in New Mexico" (PDF). New Mexico Municipal League. Archived (PDF) from the original on March 26, 2017. Retrieved March 31, 2018.
- ^ "Los Alamos County Code of Ordinance". Part I - Charter, Article I. 101. - Powers of County, Order No. 558, § 1 of June 23, 2010. Archived from the original on March 28, 2018. Retrieved March 27, 2018.
- ^ a b "New Mexico Municipal Government" (PDF). New Mexico Municipal League. 2016. Archived (PDF) from the original on March 26, 2017. Retrieved March 27, 2018.
- ^ "Places". 2020 Gazetteer Files. United States Census Bureau. Retrieved August 26, 2021.
- ^ "About Us – City of Anthony". City of Anthony NM. 2018. Archived from the original on March 28, 2018. Retrieved March 27, 2018.
- ^ "Kirtland voters approve town incorporation". Albuquerque Journal. Associated Press. January 7, 2015. Archived from the original on October 30, 2016. Retrieved June 14, 2017.
- ^ Search Results
- ^ Explore Census Data
- ^ "2000-2010 Entity Changes" (txt). 2010 United States Census. United States Census Bureau. Archived from the original on April 2, 2015. Retrieved June 17, 2016.
- ^ "History of our City". City of Rio Communities. 2014. Archived from the original on March 28, 2018. Retrieved March 27, 2018.
- ^ Explore Census Data
- ^ "Change in Resident Population of the 50 States, the District of Columbia, and Puerto Rico: 1910 to 2020" (PDF). Census.gov. United States Census Bureau. Archived (PDF) from the original on April 26, 2021. Retrieved April 27, 2020.