North West Dumfries (ward)
(Redirected from North West Dumfries)
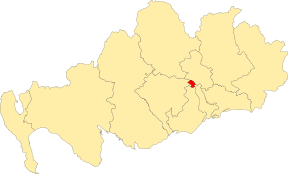
Location of the ward [1]
North West Dumfries is one of the thirteen wards used to elect members of the Dumfries and Galloway Council. It elects four Councillors.
Councillors[edit]
| Election | Councillors | |||||||
|---|---|---|---|---|---|---|---|---|
| 2007 | Ronnie Nicholson (Labour) |
David John McKie (Labour) |
John Graham Bell (Conservative) |
Doug Snell (SNP) | ||||
| 2012 | Andy Ferguson (SNP) | |||||||
| 2017 | ||||||||
| 2022 | Paula Stevenson (Labour) |
Emma Jordan (Labour) | ||||||
Election Results[edit]
2017 Election[edit]
2017 Dumfries and Galloway Council election[2]
| Party | Candidate | FPv% | Count | |||||
|---|---|---|---|---|---|---|---|---|
| 1 | 2 | 3 | 4 | 5 | ||||
| Conservative | John Graham Bell (incumbent) | 32.54 | 1,374 | |||||
| SNP | Andy Ferguson (incumbent) | 16.41 | 693 | 708.02 | 736.4 | 774.41 | 1,314.26 | |
| Labour | Ronnie Nicholson (incumbent)†† | 16.08 | 679 | 722.51 | 732.59 | 763.44 | 778.6 | |
| Labour | David John McKie (incumbent) | 14.47 | 611 | 694.93 | 720.86 | 784.57 | 809.27 | |
| SNP | Stacy Bradley | 13.60 | 574 | 588.25 | 613.02 | 642.33 | ||
| Independent | Billy Farries | 3.86 | 163 | 268.88 | 304.73 | |||
| Scottish Green | Michelle Johnston | 3.03 | 128 | 156.49 | ||||
| Electorate: 9,981 Valid: 4,222 Spoilt: 112 Quota: 845 Turnout: 42.3 | ||||||||
2012 Election[edit]
2012 Dumfries and Galloway Council election[3]
| Party | Candidate | FPv% | Count | |||||
|---|---|---|---|---|---|---|---|---|
| 1 | 2 | 3 | 4 | 5 | ||||
| Labour | Ronnie Nicholson (incumbent) | 23.25 | 932 | |||||
| Conservative | John Graham Bell (incumbent)†† | 22.43 | 899 | |||||
| Labour | David John McKie (incumbent) | 21.38 | 857 | |||||
| SNP | Andy Ferguson | 18.44 | 739 | 746.1 | 768.5 | 773.2 | 982.1 | |
| Labour | Paula Stevenson | 14.50 | 581 | 690.1 | 702.2 | 746.7 | ||
| Electorate: 9,906 Valid: 4,008 Spoilt: 66 Quota: 802 Turnout: 4,074 (40.46%) | ||||||||
2007 Election[edit]
2007 Dumfries and Galloway Council election[4]
| Party | Candidate | FPv% | Count | |||||||
|---|---|---|---|---|---|---|---|---|---|---|
| 1 | 2 | 3 | 4 | 5 | 6 | 7 | ||||
| Labour | Ronnie Nicholson | 25.6 | 1,327 | |||||||
| Conservative | John Graham Bell | 20.4 | 1,060 | |||||||
| Labour | David John McKie | 19.2 | 996 | 1,132.95 | ||||||
| SNP | Doug Snell | 15.6 | 809 | 819.85 | 824.49 | 827.34 | 864.91 | 950.22 | 1,179.06 | |
| Labour | Stephen David Harman | 12.5 | 650 | 722.49 | 789.41 | 790.64 | 823.31 | 868.90 | ||
| Liberal Democrats | Joe Sweeney | 3.6 | 188 | 192.12 | 194.25 | 197.99 | 240.41 | |||
| Independent | Arthur Tremble | 3.1 | 163 | 169.73 | 173.46 | 177.52 | ||||
| Electorate: 9,794 Valid: 5,193 Spoilt: 124 Quota: 1,039 Turnout: 54.3% | ||||||||||
References[edit]
- ^ "Scottish Boundary Commission | The Boundary Commission for Scotland is responsible for reviews of UK Parliament constituencies in Scotland".
- ^ "Council elections - May 2017".
- ^ "Local Elections Archive Project - 2012 - Dumfries and Galloway".
- ^ https://www.gallowaygazette.co.uk/news/dumfries-and-galloway-council-elections-1-334191 [dead link]

