
Rolette, North Dakota
Rolette, North Dakota | |
|---|---|
 Location of Rolette, North Dakota | |
| Coordinates: 48°39′39″N 99°50′30″W / 48.66083°N 99.84167°W | |
| Country | United States |
| State | North Dakota |
| County | Rolette |
| Founded | 1905 |
| Incorporated | 1930 |
| Area | |
| • Total | 1.01 sq mi (2.61 km2) |
| • Land | 1.01 sq mi (2.61 km2) |
| • Water | 0.00 sq mi (0.00 km2) |
| Elevation | 1,627 ft (496 m) |
| Population | |
| • Total | 484 |
| • Estimate (2022)[4] | 472 |
| • Density | 480.16/sq mi (185.46/km2) |
| Time zone | UTC-6 (Central (CST)) |
| • Summer (DST) | UTC-5 (CDT) |
| ZIP code | 58366 |
| Area code | 701 |
| FIPS code | 38-67780 |
| GNIS feature ID | 1036243[2] |
Rolette is a city in Rolette County, North Dakota, United States. The population was 484 at the 2020 census.[3]
History[edit]
Rolette was founded in 1905, and was incorporated in 1930.[5] The city took its name from Rolette County.[5] A post office has been in operation at Rolette since 1905.[6]
Geography[edit]
According to the United States Census Bureau, the city has a total area of 1.00 square mile (2.59 km2), all of it land.[7]
Climate[edit]
Rolette has a humid continental climate (Köppen Dfb), bordering on a dry-winter humid continental climate (Köppen Dwb).
| Climate data for Rolette 3SE, North Dakota, 1991–2020 normals: 1620ft (494m) | |||||||||||||
|---|---|---|---|---|---|---|---|---|---|---|---|---|---|
| Month | Jan | Feb | Mar | Apr | May | Jun | Jul | Aug | Sep | Oct | Nov | Dec | Year |
| Record high °F (°C) | 49 (9) |
53 (12) |
72 (22) |
84 (29) |
91 (33) |
96 (36) |
99 (37) |
98 (37) |
96 (36) |
85 (29) |
68 (20) |
52 (11) |
99 (37) |
| Mean maximum °F (°C) | 37.2 (2.9) |
37.1 (2.8) |
52.0 (11.1) |
73.9 (23.3) |
83.7 (28.7) |
87.6 (30.9) |
91.0 (32.8) |
92.4 (33.6) |
86.8 (30.4) |
74.3 (23.5) |
55.0 (12.8) |
37.1 (2.8) |
94.4 (34.7) |
| Mean daily maximum °F (°C) | 13.0 (−10.6) |
17.9 (−7.8) |
30.7 (−0.7) |
49.7 (9.8) |
64.1 (17.8) |
72.7 (22.6) |
77.8 (25.4) |
77.4 (25.2) |
67.9 (19.9) |
50.3 (10.2) |
32.4 (0.2) |
17.6 (−8.0) |
47.6 (8.7) |
| Daily mean °F (°C) | 2.5 (−16.4) |
6.4 (−14.2) |
20.0 (−6.7) |
37.4 (3.0) |
51.3 (10.7) |
61.3 (16.3) |
65.9 (18.8) |
63.8 (17.7) |
54.6 (12.6) |
38.7 (3.7) |
22.5 (−5.3) |
8.3 (−13.2) |
36.1 (2.3) |
| Mean daily minimum °F (°C) | −8.1 (−22.3) |
−5.1 (−20.6) |
9.4 (−12.6) |
25.1 (−3.8) |
38.4 (3.6) |
49.9 (9.9) |
54.0 (12.2) |
50.2 (10.1) |
41.2 (5.1) |
27.2 (−2.7) |
12.6 (−10.8) |
−1.0 (−18.3) |
24.5 (−4.2) |
| Mean minimum °F (°C) | −31.2 (−35.1) |
−28.1 (−33.4) |
−14.4 (−25.8) |
10.8 (−11.8) |
22.7 (−5.2) |
36.9 (2.7) |
43.0 (6.1) |
39.6 (4.2) |
28.4 (−2.0) |
14.9 (−9.5) |
−5.7 (−20.9) |
−23.0 (−30.6) |
−33.0 (−36.1) |
| Record low °F (°C) | −43 (−42) |
−42 (−41) |
−36 (−38) |
−8 (−22) |
13 (−11) |
25 (−4) |
32 (0) |
32 (0) |
20 (−7) |
4 (−16) |
−25 (−32) |
−35 (−37) |
−43 (−42) |
| Average precipitation inches (mm) | 0.48 (12) |
0.49 (12) |
0.91 (23) |
1.21 (31) |
2.81 (71) |
4.14 (105) |
3.02 (77) |
2.25 (57) |
1.89 (48) |
1.42 (36) |
0.74 (19) |
0.86 (22) |
20.22 (513) |
| Average snowfall inches (cm) | 7.4 (19) |
7.8 (20) |
6.7 (17) |
2.6 (6.6) |
2.2 (5.6) |
0.0 (0.0) |
0.0 (0.0) |
0.0 (0.0) |
0.0 (0.0) |
2.7 (6.9) |
4.8 (12) |
12.6 (32) |
46.8 (119.1) |
| Source 1: NOAA[8] | |||||||||||||
| Source 2: XMACIS (1999-2010 snowfall, records & monthly max/mins)[9] | |||||||||||||
Demographics[edit]
| Census | Pop. | Note | %± |
|---|---|---|---|
| 1910 | 408 | — | |
| 1920 | 409 | 0.2% | |
| 1930 | 428 | 4.6% | |
| 1940 | 460 | 7.5% | |
| 1950 | 451 | −2.0% | |
| 1960 | 524 | 16.2% | |
| 1970 | 579 | 10.5% | |
| 1980 | 667 | 15.2% | |
| 1990 | 623 | −6.6% | |
| 2000 | 538 | −13.6% | |
| 2010 | 594 | 10.4% | |
| 2020 | 484 | −18.5% | |
| 2022 (est.) | 472 | [4] | −2.5% |
| U.S. Decennial Census[10] 2020 Census[3] | |||
2010 census[edit]
As of the census of 2010, there were 594 people in 254 households, including 141 families, in the city. The population density was 594.0 inhabitants per square mile (229.3/km2). There were 284 housing units at an average density of 284.0 per square mile (109.7/km2). The racial makup of the city was 56.9% White, 0.2% African American, 37.9% Native American, 0.2% from other races, and 4.9% from two or more races. Hispanic or Latino of any race were 1.0%.
Of the 254 households 29.5% had children under the age of 18 living with them, 35.0% were married couples living together, 15.0% had a female householder with no husband present, 5.5% had a male householder with no wife present, and 44.5% were non-families. 39.0% of households were one person and 16.5% were one person aged 65 or older. The average household size was 2.19 and the average family size was 2.92.
The median age was 43 years. 24.1% of residents were under the age of 18; 7.9% were between the ages of 18 and 24; 19.4% were from 25 to 44; 25.1% were from 45 to 64; and 23.6% were 65 or older. The gender makeup of the city was 48.1% male and 51.9% female.
2000 census[edit]
As of the census of 2000, there were 538 people in 243 households, including 140 families, in the city. The population density was 535.4 inhabitants per square mile (206.7/km2). There were 286 housing units at an average density of 284.6 per square mile (109.9/km2). The racial makup of the city was 75.46% White, 21.00% Native American, and 3.53% from two or more races.
Of the 243 households 26.7% had children under the age of 18 living with them, 42.4% were married couples living together, 11.9% had a female householder with no husband present, and 42.0% were non-families. 40.7% of households were one person and 18.1% were one person aged 65 or older. The average household size was 2.02 and the average family size was 2.70.
The age distribution was 20.6% under the age of 18, 6.9% from 18 to 24, 20.8% from 25 to 44, 22.7% from 45 to 64, and 29.0% 65 or older. The median age was 46 years. For every 100 females, there were 94.2 males. For every 100 females age 18 and over, there were 85.7 males.
The median household income was $27,500 and the median family income was $36,563. Males had a median income of $28,750 versus $21,827 for females. The per capita income for the city was $15,742. About 12.8% of families and 16.8% of the population were below the poverty line, including 27.9% of those under age 18 and 7.3% of those age 65 or over.
Education[edit]
It is zoned to Rolette Public School.[11]
Notable people[edit]
- Kevin Cramer, U.S. Senator, former U.S. Representative
- Randy Kelly, Minnesota legislator and mayor of Saint Paul, Minnesota
- William C. Marcil, chief executive officer of Forum Communications
References[edit]
- ^ "ArcGIS REST Services Directory". United States Census Bureau. Retrieved September 20, 2022.
- ^ a b U.S. Geological Survey Geographic Names Information System: Rolette, North Dakota
- ^ a b c "Explore Census Data". United States Census Bureau. Retrieved November 7, 2023.
- ^ a b "City and Town Population Totals: 2020-2022". United States Census Bureau. November 7, 2023. Retrieved November 7, 2023.
- ^ a b "Explain Origin of All County Towns". Turtle Mountain Star. September 5, 1940. p. 7. Retrieved May 2, 2015.
- ^ "Rolette County". Jim Forte Postal History. Retrieved February 14, 2015.
- ^ "US Gazetteer files 2010". United States Census Bureau. Archived from the original on July 2, 2012. Retrieved June 14, 2012.
- ^ "Rolette 3SE, North Dakota 1991-2020 Monthly Normals". Retrieved December 22, 2023.
- ^ "xmACIS". National Oceanic and Atmospheric Administration. Retrieved December 22, 2023.
- ^ United States Census Bureau. "Census of Population and Housing". Retrieved January 19, 2014.
- ^ "2020 CENSUS - SCHOOL DISTRICT REFERENCE MAP: Rolette County, ND" (PDF). United States Census Bureau. Retrieved August 25, 2021.
Municipalities and communities of Rolette County, North Dakota, United States | ||
|---|---|---|
| Cities | 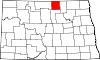 | |
| Townships | ||
| Unorganized territories | ||
| CDPs | ||
| Other communities | ||
| Indian reservation | ||
| Footnotes | ‡This populated place also has portions in an adjacent county or counties | |
| International | |
|---|---|
| National | |