Tulip (software)
 | |
| Developer(s) | David Auber, Patrick Mary |
|---|---|
| Initial release | 30 May 2001 |
| Stable release | 5.7.2
/ 30 June 2023 |
| Written in | C++ |
| Operating system | Linux, Windows, Mac OS X |
| Size | 114.6 MB |
| Type | Visualization |
| License | GNU Lesser General Public License |
| Website | tulip |
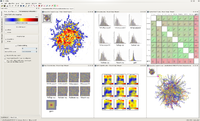
Tulip is an information visualization framework dedicated to the analysis and visualization of relational data. Tulip aims to provide the developer with a complete library, supporting the design of interactive information visualization applications for relational data that can be tailored to the problems being addressed. It is developed at LaBRI, the laboratory for research in computer science of the University of Bordeaux.
Written in C++, the framework enables the development of algorithms, visual encodings, interaction techniques, data models, and domain-specific visualizations. Tulip allows the reuse of components; this makes the framework efficient for research prototyping as well as the development of end-user applications. It has a binding for Python.[1]
Tulip is easy to use and offers very appealing visualization.[2]
Initially, Tulip targeted only graph visualization. Since then, it has evolved to be a more general-purpose data visualization software. Tulip can work with very huge data sets, e.g. 1,000,000 nodes and 5,000,000 edges.[3]
References[edit]
- ^ "Tulip - Data Visualization Software - Taufiq Kurniawan". 2020-04-04. Retrieved 2023-07-24.
- ^ Pavlopoulos, Georgios A.; Paez-Espino, David; Kyrpides, Nikos C.; Iliopoulos, Ioannis (2017-07-18). "Empirical Comparison of Visualization Tools for Larger-Scale Network Analysis". Advances in Bioinformatics. 2017: e1278932. doi:10.1155/2017/1278932. ISSN 1687-8027. PMC 5540468. PMID 28804499.
- ^ Auber; Bourqui; Melançon; Pinaud; et al. (12 June 2017). "Tulip 5" (PDF). Retrieved 24 July 2023.
