
Wattenwil
Wattenwil | |
|---|---|
 Coat of arms | |
Location of Wattenwil  | |
 Wattenwil  Wattenwil | |
| Coordinates: 46°46′N 7°30′E / 46.767°N 7.500°E | |
| Country | Switzerland |
| Canton | Bern |
| District | Thun |
| Government | |
| • Mayor | Peter Hänni |
| Area | |
| • Total | 14.54 km2 (5.61 sq mi) |
| Elevation | 603 m (1,978 ft) |
| Population (31 December 2018)[2] | |
| • Total | 2,935 |
| • Density | 200/km2 (520/sq mi) |
| Time zone | UTC+01:00 (Central European Time) |
| • Summer (DST) | UTC+02:00 (Central European Summer Time) |
| Postal code(s) | 3665 |
| SFOS number | 0886 |
| ISO 3166 code | CH-BE |
| Surrounded by | Blumenstein, Burgistein, Forst, Gurzelen, Längenbühl, Rüti bei Riggisberg |
| Website | www SFSO statistics |
Wattenwil is a municipality in the administrative district of Thun in the canton of Bern in Switzerland.
History[edit]
Wattenwil is first mentioned in 1226 as Watenwile.[3]
The oldest traces of a settlement in the area are several Bronze Age graves around Vorderrainstrasse and Höstettli. During the Middle Ages Wattenwil was owned by the Counts of Neuchâtel-Nidau. After the murder of Albert I of Germany in 1308 by Duke John Parricida, the area was sold or pledged to the Barons of Strättligen. The Barons held the villages until the extinction of their line in 1349, after which it was inherited by the Lords of Burgistein. The three settlements that today make up Wattenwil never had a central village, castle or manor house. However, it was the center of a high court with gallows. In 1376, the city-state of Bern acquired control of the nearby city of Nidau and began expanding their power over the region. In 1388 Bern acquired rights over the Wattenwil area, however the high court and gallows remained under the authority of local nobles who opposed Bernese expansion. Bern created the Seftigen District court to oppose the Wattenwil court and expand their power in the region. Partially in 1499 and more fully in 1516 the Bernese citizen Bartholomew May acquired the Strättligen lands and ownership of Wattenwil. Over the following century it was bought and inherited several times, until 1641 when the farmers of Wattenwil bought the right to self-government. However, in the following year, they sold the right to Bern for 1000 pounds and became part of the District of Seftigen.[3]
For much of the history of the villages, they were part of the parish of Thurnen with a local chapel. In 1659 they broke away from Thurnen to become an independent parish. In 1683 the chapel was replaced with a larger parish church, which still stands today.[3]
In 1887 a hospital opened in the municipality. It gradually grew into a district hospital which served Wattenwil and nine other municipalities. The hospital and the secondary school, which opened in 1902, made Wattenwil into a regional center. The local economy is based on agriculture, cheese production, forestry and small businesses. Over half of the work force commutes to jobs in nearby cities.[3]
Geography[edit]
Wattenwil has an area of 14.54 km2 (5.61 sq mi).[4] As of 2012, a total of 5.91 km2 (2.28 sq mi) or 40.6% is used for agricultural purposes, while 7.18 km2 (2.77 sq mi) or 49.4% is forested. The rest of the municipality is 1.13 km2 (0.44 sq mi) or 7.8% is settled (buildings or roads), 0.21 km2 (0.081 sq mi) or 1.4% is either rivers or lakes and 0.04 km2 (9.9 acres) or 0.3% is unproductive land.[5]
During the same year, housing and buildings made up 4.8% and transportation infrastructure made up 2.0%. A total of 47.3% of the total land area is heavily forested and 2.1% is covered with orchards or small clusters of trees. Of the agricultural land, 13.1% is used for growing crops and 25.9% is pasturage, while 1.7% is used for orchards or vine crops. All the water in the municipality is flowing water.[5]
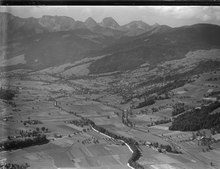
The municipality is located in the upper Gürbetal on the eastern slope of Gurnigel Mountain. It consists of the scattered settlements of Dorf, Mettlen and Grundbach.
On 31 December 2009 Amtsbezirk Seftigen, the municipality's former district, was dissolved. On the following day, 1 January 2010, it joined the newly created Verwaltungskreis Thun.[6]
Coat of arms[edit]
The blazon of the municipal coat of arms is Gules three Wings sinister Or.[7]
Demographics[edit]
Wattenwil has a population (as of December 2020[update]) of 3,060.[8] As of 2012[update], 2.8% of the population are resident foreign nationals. Between the last 2 years (2010-2012) the population changed at a rate of 2.7%. Migration accounted for 3.1%, while births and deaths accounted for -0.5%.[9]
Most of the population (as of 2000[update]) speaks German (2,648 or 95.6%) as their first language, Albanian is the second most common (22 or 0.8%) and Italian is the third (12 or 0.4%). There are 10 people who speak French.[10]
As of 2008[update], the population was 49.0% male and 51.0% female. The population was made up of 1,251 Swiss men (47.1% of the population) and 49 (1.8%) non-Swiss men. There were 1,321 Swiss women (49.8%) and 34 (1.3%) non-Swiss women.[11] Of the population in the municipality, 1,035 or about 37.4% were born in Wattenwil and lived there in 2000. There were 1,160 or 41.9% who were born in the same canton, while 274 or 9.9% were born somewhere else in Switzerland, and 158 or 5.7% were born outside of Switzerland.[10]
As of 2012[update], children and teenagers (0–19 years old) make up 22.8% of the population, while adults (20–64 years old) make up 59.9% and seniors (over 64 years old) make up 17.2%.[9]
As of 2000[update], there were 1,175 people who were single and never married in the municipality. There were 1,268 married individuals, 218 widows or widowers and 109 individuals who are divorced.[10]
As of 2010[update], there were 332 households that consist of only one person and 101 households with five or more people.[12] In 2000[update], a total of 996 apartments (85.1% of the total) were permanently occupied, while 133 apartments (11.4%) were seasonally occupied and 42 apartments (3.6%) were empty.[13] As of 2012[update], the construction rate of new housing units was 6.6 new units per 1000 residents.[9] The vacancy rate for the municipality, in 2013[update], was 1.1%. In 2011, single family homes made up 44.9% of the total housing in the municipality.[14]
The historical population is given in the following chart:[3][15][16]

Politics[edit]
In the 2011 federal election the most popular party was the Swiss People's Party (SVP) which received 38.5% of the vote. The next three most popular parties were the Conservative Democratic Party (BDP) (13.5%), the Social Democratic Party (SP) (12.7%) and the Evangelical People's Party (EVP) (7.6%). In the federal election, a total of 1,007 votes were cast, and the voter turnout was 47.3%.[17]
Economy[edit]
As of 2011[update], Wattenwil had an unemployment rate of 1.35%. As of 2011[update], there were a total of 1,032 people employed in the municipality. Of these, there were 129 people employed in the primary economic sector and about 47 businesses involved in this sector. 273 people were employed in the secondary sector and there were 49 businesses in this sector. 630 people were employed in the tertiary sector, with 127 businesses in this sector.[9] There were 1,343 residents of the municipality who were employed in some capacity, of which females made up 41.7% of the workforce.
In 2008[update] there were a total of 809 full-time equivalent jobs. The number of jobs in the primary sector was 79, of which 75 were in agriculture and 4 were in forestry or lumber production. The number of jobs in the secondary sector was 249 of which 91 or (36.5%) were in manufacturing and 158 (63.5%) were in construction. The number of jobs in the tertiary sector was 481. In the tertiary sector; 101 or 21.0% were in wholesale or retail sales or the repair of motor vehicles, 26 or 5.4% were in the movement and storage of goods, 16 or 3.3% were in a hotel or restaurant, 9 or 1.9% were in the information industry, 5 or 1.0% were the insurance or financial industry, 12 or 2.5% were technical professionals or scientists, 47 or 9.8% were in education and 217 or 45.1% were in health care.[18]
In 2000[update], there were 428 workers who commuted into the municipality and 789 workers who commuted away. The municipality is a net exporter of workers, with about 1.8 workers leaving the municipality for every one entering. A total of 554 workers (56.4% of the 982 total workers in the municipality) both lived and worked in Wattenwil.[19] Of the working population, 14.2% used public transportation to get to work, and 55.2% used a private car.[9]
In 2011 the average local and cantonal tax rate on a married resident, with two children, of Wattenwil making 150,000 CHF was 12.7%, while an unmarried resident's rate was 18.7%.[20] For comparison, the average rate for the entire canton in the same year, was 14.2% and 22.0%, while the nationwide average was 12.3% and 21.1% respectively.[21]
In 2009 there were a total of 1,202 tax payers in the municipality. Of that total, 316 made over 75,000 CHF per year. There were 12 people who made between 15,000 and 20,000 per year. The greatest number of workers, 355, made between 50,000 and 75,000 CHF per year. The average income of the over 75,000 CHF group in Wattenwil was 104,201 CHF, while the average across all of Switzerland was 130,478 CHF.[22]
In 2011 a total of 3.0% of the population received direct financial assistance from the government.[23]
Religion[edit]
From the 2000 census[update], 2,140 or 77.3% belonged to the Swiss Reformed Church, while 125 or 4.5% were Roman Catholic. Of the rest of the population, there were 6 members of an Orthodox church (or about 0.22% of the population), and there were 143 individuals (or about 5.16% of the population) who belonged to another Christian church. There were 2 individuals (or about 0.07% of the population) who were Jewish, and 51 (or about 1.84% of the population) who were Muslim. There were 2 individuals who were Buddhist, 13 individuals who were Hindu and 5 individuals who belonged to another church. 143 (or about 5.16% of the population) belonged to no church, are agnostic or atheist, and 140 individuals (or about 5.05% of the population) did not answer the question.[10]
Education[edit]
In Wattenwil about 59% of the population have completed non-mandatory upper secondary education, and 13.1% have completed additional higher education (either university or a Fachhochschule).[9] Of the 213 who had completed some form of tertiary schooling listed in the census, 75.1% were Swiss men, 18.3% were Swiss women, 4.7% were non-Swiss men.[10]
The Canton of Bern school system provides one year of non-obligatory Kindergarten, followed by six years of Primary school. This is followed by three years of obligatory lower Secondary school where the students are separated according to ability and aptitude. Following the lower Secondary students may attend additional schooling or they may enter an apprenticeship.[24]
During the 2011-12 school year, there were a total of 450 students attending classes in Wattenwil. There were 3 kindergarten classes with a total of 48 students in the municipality. Of the kindergarten students, 4.2% were permanent or temporary residents of Switzerland (not citizens) and 4.2% have a different mother language than the classroom language. The municipality had 11 primary classes and 185 students. Of the primary students, 1.6% were permanent or temporary residents of Switzerland (not citizens) and 7.0% have a different mother language than the classroom language. During the same year, there were 11 lower secondary classes with a total of 217 students. There were 2.8% who were permanent or temporary residents of Switzerland (not citizens) and 3.2% have a different mother language than the classroom language.[25]
As of 2000[update], there were a total of 482 students attending any school in the municipality. Of those, 348 both lived and attended school in the municipality, while 134 students came from another municipality. During the same year, 48 residents attended schools outside the municipality.[19]
Wattenwil is home to the Schul- und Gemeindebibliothek Wattenwil (municipal library of Wattenwil). The library has (as of 2008[update]) 9,810 books or other media, and loaned out 29,509 items in the same year. It was open a total of 176 days with average of 9 hours per week during that year.[26]
References[edit]
- ^ a b "Arealstatistik Standard - Gemeinden nach 4 Hauptbereichen". Federal Statistical Office. Retrieved 13 January 2019.
- ^ "Ständige Wohnbevölkerung nach Staatsangehörigkeitskategorie Geschlecht und Gemeinde; Provisorische Jahresergebnisse; 2018". Federal Statistical Office. 9 April 2019. Retrieved 11 April 2019.
- ^ a b c d e Wattenwil in German, French and Italian in the online Historical Dictionary of Switzerland.
- ^ Arealstatistik Standard - Gemeindedaten nach 4 Hauptbereichen
- ^ a b Swiss Federal Statistical Office-Land Use Statistics 2009 data (in German) accessed 25 March 2010
- ^ Nomenklaturen – Amtliches Gemeindeverzeichnis der Schweiz (in German) accessed 4 April 2011
- ^ Flags of the World.com accessed 5 May 2014
- ^ "Ständige und nichtständige Wohnbevölkerung nach institutionellen Gliederungen, Geburtsort und Staatsangehörigkeit". bfs.admin.ch (in German). Swiss Federal Statistical Office - STAT-TAB. 31 December 2020. Retrieved 21 September 2021.
- ^ a b c d e f Swiss Federal Statistical Office accessed 5 May 2014
- ^ a b c d e STAT-TAB Datenwürfel für Thema 40.3 - 2000 (in German) accessed 2 February 2011
- ^ Statistical office of the Canton of Bern (in German) accessed 4 January 2012
- ^ Swiss Federal Statistical Office - Haushaltsgrösse (in German) accessed 8 May 2013
- ^ Swiss Federal Statistical Office STAT-TAB - Datenwürfel für Thema 09.2 - Gebäude und Wohnungen (in German) accessed 28 January 2011
- ^ Statistischer Atlas der Schweiz - Anteil Einfamilienhäuser am gesamten Gebäudebestand, 2011 accessed 17 June 2013
- ^ Swiss Federal Statistical Office STAT-TAB Bevölkerungsentwicklung nach Region, 1850-2000 (in German) accessed 29 January 2011
- ^ Swiss Federal Statistical Office - Ständige Wohnbevölkerung in Privathaushalten nach Gemeinde und Haushaltsgrösse (in German) accessed 12 August 2013
- ^ Swiss Federal Statistical Office 2011 Election (in German) accessed 8 May 2012
- ^ Swiss Federal Statistical Office STAT-TAB Betriebszählung: Arbeitsstätten nach Gemeinde und NOGA 2008 (Abschnitte), Sektoren 1-3 (in German) accessed 28 January 2011
- ^ a b Swiss Federal Statistical Office - Statweb (in German) accessed 24 June 2010
- ^ Statistischer Atlas der Schweiz - Steuerbelastung, 2011 Politische Gemeinden (in German) accessed 15 May 2013
- ^ Swiss Federal Tax Administration - Grafische Darstellung der Steuerbelastung 2011 in den Kantonen (in German and French) accessed 17 June 2013
- ^ Federal Tax Administration Report Direkte Bundessteuer - Natürliche Personen - Gemeinden - Steuerjahr 2009 (in German and French) accessed 15 May 2013
- ^ Statistischer Atlas der Schweiz - Bezüger/-innen von Sozialhilfeleistungen (Sozialhilfeempfänger/-innen), 2011 accessed 18 June 2013
- ^ EDK/CDIP/IDES (2010). Kantonale Schulstrukturen in der Schweiz und im Fürstentum Liechtenstein / Structures Scolaires Cantonales en Suisse et Dans la Principauté du Liechtenstein (PDF) (Report). Retrieved 24 June 2010.
- ^ Schuljahr 2011/12 pdf document(in German) accessed 9 May 2013
- ^ Swiss Federal Statistical Office, list of libraries (in German) accessed 14 May 2010
| International | |
|---|---|
| Other | |