File:20190704 Warming stripes - HadCRUT.4.6.0.0 - world.png

Page contents not supported in other languages.
This is a file from the Wikimedia Commons
From Wikipedia, the free encyclopedia

Original file(3,200 × 1,800 pixels, file size: 39 KB, MIME type: image/png)

Summary

Description
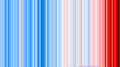
English: w:Warming stripes w:data visualization diagram that represents temperature deviations above (in red stripes) and below (in blue stripes) a 1961-1990 average value.

General notes:

  • Credit for general concept of w:warming stripes: climate scientist Ed Hawkins, w:University of Reading, U.K.
  • Data values are visualized using color rather than locations of points on a graph.
  • The average temperature in reference period 1961-1990 determines boundary between blue and red.
  • Horizontal scale is time, from 1850 (left) to 2018 (right).
  • Each hue (up to 8 blue and 8 red) covers a temperature range of 0.1 degrees Celsius.
  • Data is global (not for a locality).

Source documentation re the underlying data:
https://www.metoffice.gov.uk/hadobs/hadcrut4/index.html
https://web.archive.org/web/20190102231319/https://www.metoffice.gov.uk/hadobs/hadcrut4/index.html

"HadCRUT4 is a gridded dataset of global historical surface temperature anomalies relative to a 1961-1990 reference period. Data are available for each month since January 1850, on a 5 degree grid. The dataset is a collaborative product of the Met Office Hadley Centre and the Climatic Research Unit at the University of East Anglia.
"The gridded data are a blend of the CRUTEM4 land-surface air temperature dataset and the HadSST3 sea-surface temperature (SST) dataset. The dataset is presented as an ensemble of 100 dataset realisations that sample the distribution of uncertainty in the global temperature record given current understanding of non-climatic factors affecting near-surface temperature observations. This ensemble approach allows characterisation of spatially and temporally correlated uncertainty structure in the gridded data, for example arising from uncertainties in methods used to account for changes in SST measurement practices, homogenisation of land station records and the potential impacts of urbanisation.
"The HadCRUT4 data are neither interpolated nor variance adjusted."

Recommended source citation for the data:

  • Morice, C. P., J. J. Kennedy, N. A. Rayner, and P. D. Jones (2012), Quantifying uncertainties in global and regional temperature change using an ensemble of observational estimates: The HadCRUT4 dataset, J. Geophys. Res., 117, D08101, doi:10.1029/2011JD017187.
  • From wikitext, with link: (April 17, 2012). "Quantifying uncertainties in global and regional temperature change using an ensemble of observational estimates: The HadCRUT4 dataset". J. Geophys. Res. 117 (D8). DOI:10.1029/2011JD017187.

FAQ re the datasets:
https://www.metoffice.gov.uk/hadobs/hadcrut4/faq.html
https://web.archive.org/web/20190119092400/https://www.metoffice.gov.uk/hadobs/hadcrut4/faq.html

Actual download page:
https://www.metoffice.gov.uk/hadobs/hadcrut4/data/current/download.html
https://web.archive.org/web/20190619234924/https://www.metoffice.gov.uk/hadobs/hadcrut4/data/current/download.html

Creator/Uploader's remarks:

  • I averaged only datasets 1-10 from the 100 HadCRUT4 "Global (NH+SH)/2" datasets, since the standard deviation among each of the 170 year-wise averaged values was small (only 0.01 - 0.02 degrees). That is, the datasets substantially agreed.
  • I averaged the datasets year-wise in Microsoft Excel, and separated the averaged values into categories with "cutoff" (boundary) temperature deviations being multiples of 0.1 degrees (a simple linear relation). I assembled color-coded rectangles in Microsoft Powerpoint, exported, and re-sized using Photoshop.
  • My resulting warming stripes diagram differs from that published by Ed Hawkins because he used different dataset than I did. Mine is based on deviation from a 1961-1990 reference period average, whereas Hawkins' data used a 1971-2000 reference period (separating blue from red). Mine includes data for 2019, whereas Hawkins' June 2019 warming diagram ended with 2018 data. My "cutoff" temperatures (which determine boundaries between adjacent color bands) is probably different, and less sophisticated. I used a different color scheme.
  • I made a typo in the remarks for uploading Version 3: it is 3200x1800 (not 2100x1800).
Click at right to show/hide ACTUAL DATA

Year-wise averages of data from datasets 1-10 (only):

YEAR Average of Datasets 1-10 (only)
1850 -0.353
1851 -0.199
1852 -0.208
1853 -0.249
1854 -0.230
1855 -0.253
1856 -0.338
1857 -0.443
1858 -0.448
1859 -0.269
1860 -0.331
1861 -0.393
1862 -0.508
1863 -0.268
1864 -0.484
1865 -0.272
1866 -0.237
1867 -0.305
1868 -0.224
1869 -0.247
1870 -0.260
1871 -0.318
1872 -0.213
1873 -0.287
1874 -0.351
1875 -0.381
1876 -0.367
1877 -0.059
1878 0.050
1879 -0.216
1880 -0.213
1881 -0.187
1882 -0.202
1883 -0.283
1884 -0.397
1885 -0.378
1886 -0.359
1887 -0.410
1888 -0.296
1889 -0.162
1890 -0.408
1891 -0.323
1892 -0.448
1893 -0.466
1894 -0.400
1895 -0.383
1896 -0.178
1897 -0.198
1898 -0.405
1899 -0.280
1900 -0.195
1901 -0.251
1902 -0.394
1903 -0.472
1904 -0.513
1905 -0.370
1906 -0.273
1907 -0.459
1908 -0.506
1909 -0.516
1910 -0.485
1911 -0.539
1912 -0.433
1913 -0.421
1914 -0.240
1915 -0.139
1916 -0.379
1917 -0.464
1918 -0.329
1919 -0.270
1920 -0.247
1921 -0.189
1922 -0.299
1923 -0.277
1924 -0.293
1925 -0.217
1926 -0.107
1927 -0.210
1928 -0.205
1929 -0.350
1930 -0.137
1931 -0.085
1932 -0.136
1933 -0.271
1934 -0.128
1935 -0.175
1936 -0.144
1937 -0.024
1938 -0.004
1939 -0.050
1940 0.014
1941 0.026
1942 -0.027
1943 -0.005
1944 0.143
1945 0.024
1946 -0.062
1947 -0.025
1948 -0.026
1949 -0.064
1950 -0.162
1951 -0.040
1952 0.043
1953 0.109
1954 -0.118
1955 -0.182
1956 -0.261
1957 -0.002
1958 0.052
1959 0.021
1960 -0.046
1961 0.044
1962 0.020
1963 0.054
1964 -0.218
1965 -0.137
1966 -0.065
1967 -0.071
1968 -0.110
1969 0.037
1970 -0.022
1971 -0.181
1972 -0.062
1973 0.064
1974 -0.212
1975 -0.148
1976 -0.242
1977 0.047
1978 -0.065
1979 0.054
1980 0.091
1981 0.137
1982 0.006
1983 0.188
1984 -0.019
1985 -0.034
1986 0.042
1987 0.190
1988 0.197
1989 0.115
1990 0.295
1991 0.254
1992 0.105
1993 0.149
1994 0.208
1995 0.322
1996 0.179
1997 0.388
1998 0.536
1999 0.303
2000 0.295
2001 0.441
2002 0.497
2003 0.509
2004 0.450
2005 0.546
2006 0.506
2007 0.493
2008 0.396
2009 0.505
2010 0.560
2011 0.425
2012 0.470
2013 0.514
2014 0.580
2015 0.763
2016 0.796
2017 0.678
2018 0.597
2019 0.762 Data for 2019 not used, beginning with Version 3 of this Wikimedia file.


Date
Source Own work
Author RCraig09
Other versions

Incorporated into the following images:

20190707 Compare warming stripes - HadCRUT vs Berkeley Earth - both 1961-1990 ref period
20190711 Comparing warming stripes - GISS, GHCN-v3, HadCRUT4.6.0.0, Berkeley Earth (1961-1990 ref)

Related files

Licensing

I, the copyright holder of this work, hereby publish it under the following license:
w:en:Creative Commons
attribution share alike
This file is licensed under the Creative Commons Attribution-Share Alike 4.0 International license.
You are free:
  • to share – to copy, distribute and transmit the work
  • to remix – to adapt the work
Under the following conditions:
  • attribution – You must give appropriate credit, provide a link to the license, and indicate if changes were made. You may do so in any reasonable manner, but not in any way that suggests the licensor endorses you or your use.
  • share alike – If you remix, transform, or build upon the material, you must distribute your contributions under the same or compatible license as the original.

Captions

[[w:Warming stripes]] for 1850-2018 from a subset of HadCRUT.4.6.0.0 database

Items portrayed in this file

depicts

4 July 2019

image/png

b4ffe9ebdcb3611885a017024cacbe25691d41b7

40,107 byte

1,800 pixel

3,200 pixel

File history

Click on a date/time to view the file as it appeared at that time.

Date/TimeThumbnailDimensionsUserComment
current02:24, 31 July 2019Thumbnail for version as of 02:24, 31 July 20193,200 × 1,800 (39 KB)RCraig09Including thin purple bar (lower edge) to delineate the 1961-1990 reference period, whose average determines red-blue boundary.
02:14, 6 July 2019Thumbnail for version as of 02:14, 6 July 20193,200 × 1,800 (39 KB)RCraig09Making stripes uniform width and consistent spacing. . . . Removing stripe for 2019 since it's still July 2019 and data may not be as complete as for previous years, plus it's easier to compare with other warming stripe graphics that only go through 2018. . . . Is now 1850-2018. . . . Changing size to 2100x1800 (16x9 aspect ratio).
20:41, 4 July 2019Thumbnail for version as of 20:41, 4 July 20194,608 × 2,592 (72 KB)RCraig09Punctuation and capitalization corrections in legend (lower right, tiny)
16:34, 4 July 2019Thumbnail for version as of 16:34, 4 July 20194,608 × 2,592 (71 KB)RCraig09User created page with UploadWizard
The following pages on the English Wikipedia use this file (pages on other projects are not listed):

Global file usage

The following other wikis use this file:

Metadata