File:20190704 Warming stripes - HadCRUT.4.6.0.0 - world (no text).png

This is a file from the Wikimedia Commons
From Wikipedia, the free encyclopedia

Original file(3,200 × 1,920 pixels, file size: 22 KB, MIME type: image/png)

Summary

Description
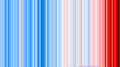
English: Warming stripes data visualization diagram that represents temperature deviations above (in red stripes) and below (in blue stripes) a 1961-1990 average value

General notes:

  • Credit for general concept of w:warming stripes: climate scientist Ed Hawkins, w:University of Reading, UK.
  • Data values are visualized using color rather than locations of points on a graph.
  • The average temperature in reference period 1961-1990 determines boundary between blue and red.
  • Horizontal scale is time, from 1850 (left) to 2018 (right).
  • Each hue (up to 8 blue and 8 red) covers a temperature range of 0.1 degrees Celsius.
  • Data is global (not for a locality).

Source documentation re the underlying data:
https://www.metoffice.gov.uk/hadobs/hadcrut4/index.html
https://web.archive.org/web/20190102231319/https://www.metoffice.gov.uk/hadobs/hadcrut4/index.html

"HadCRUT4 is a gridded dataset of global historical surface temperature anomalies relative to a 1961-1990 reference period. Data are available for each month since January 1850, on a 5 degree grid. The dataset is a collaborative product of the Met Office Hadley Centre and the Climatic Research Unit at the University of East Anglia.
"The gridded data are a blend of the CRUTEM4 land-surface air temperature dataset and the HadSST3 sea-surface temperature (SST) dataset. The dataset is presented as an ensemble of 100 dataset realisations that sample the distribution of uncertainty in the global temperature record given current understanding of non-climatic factors affecting near-surface temperature observations. This ensemble approach allows characterisation of spatially and temporally correlated uncertainty structure in the gridded data, for example arising from uncertainties in methods used to account for changes in SST measurement practices, homogenisation of land station records and the potential impacts of urbanisation.
"The HadCRUT4 data are neither interpolated nor variance adjusted."

Recommended source citation for the data:

  • Morice, C. P., J. J. Kennedy, N. A. Rayner, and P. D. Jones (2012), Quantifying uncertainties in global and regional temperature change using an ensemble of observational estimates: The HadCRUT4 dataset, J. Geophys. Res., 117, D08101, doi:10.1029/2011JD017187.
  • From wikitext, with link: (April 17, 2012). "Quantifying uncertainties in global and regional temperature change using an ensemble of observational estimates: The HadCRUT4 dataset". J. Geophys. Res. 117 (D8). DOI:10.1029/2011JD017187.

FAQ re the datasets:
https://www.metoffice.gov.uk/hadobs/hadcrut4/faq.html
https://web.archive.org/web/20190119092400/https://www.metoffice.gov.uk/hadobs/hadcrut4/faq.html Actual download page:
https://www.metoffice.gov.uk/hadobs/hadcrut4/data/current/download.html

https://web.archive.org/web/20190619234924/https://www.metoffice.gov.uk/hadobs/hadcrut4/data/current/download.html
Date
Source This file was derived from: 20190704 Warming stripes - HadCRUT.4.6.0.0 - world.png
Author RCraig09
Permission
(Reusing this file)
w:en:Creative Commons
attribution share alike
This file is licensed under the Creative Commons Attribution-Share Alike 4.0 International license.
You are free:
  • to share – to copy, distribute and transmit the work
  • to remix – to adapt the work
Under the following conditions:
  • attribution – You must give appropriate credit, provide a link to the license, and indicate if changes were made. You may do so in any reasonable manner, but not in any way that suggests the licensor endorses you or your use.
  • share alike – If you remix, transform, or build upon the material, you must distribute your contributions under the same or compatible license as the original.

Related files

Captions

Add a one-line explanation of what this file represents

Items portrayed in this file

depicts

4 July 2019

image/png

f3ada86f278192f20201cd1cd0ba939370d1aaf7

22,361 byte

1,920 pixel

3,200 pixel

File history

Click on a date/time to view the file as it appeared at that time.

Date/TimeThumbnailDimensionsUserComment
current17:14, 15 August 2019Thumbnail for version as of 17:14, 15 August 20193,200 × 1,920 (22 KB)David Levy{{Information |description = {{en|Warming stripes data visualization diagram that represents temperature deviations above (in red stripes) and below (in blue stripes) a 1961-1990 average value ''General notes:'' * ''Credit for general concept of w:warming stripes:'' climate scientist Ed Hawkins, w:University of Reading, UK. * Data values are visualized using color rather than locations of points on a graph. * The average temperature in re...
The following pages on the English Wikipedia use this file (pages on other projects are not listed):