
File:20240625 Global warming across generations - warming stripes.svg

Size of this PNG preview of this SVG file: 660 × 600 pixels. Other resolutions: 264 × 240 pixels | 528 × 480 pixels | 846 × 768 pixels | 1,127 × 1,024 pixels | 2,255 × 2,048 pixels | 1,200 × 1,090 pixels.
Original file (SVG file, nominally 1,200 × 1,090 pixels, file size: 20 KB)
| This is a file from the Wikimedia Commons. Information from its description page there is shown below. Commons is a freely licensed media file repository. You can help. |
Summary
| Description |
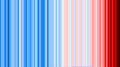
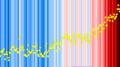
English: Diagram showing chart of global warming over time, juxtaposed with timeline showing lifetimes of various generations
|
||
| Date | |||
| Source | Own work | ||
| Author | RCraig09 |

Related files
-
 20190705 Warming stripes - Berkeley Earth (world) - avg above- and below-ice readings.png
PNG predecessor (early version, not using ColorBrewer hues) -
 1850- Warming stripes - global average surface temperature.svg
SVG successor -
 20190705 Warming stripes BEHIND line graph - Berkeley Earth (world).png
PNG predecessor (early version, not using ColorBrewer hues) -
 20240311 Warming stripes BEHIND line chart - global surface temperature.svg
SVG - warming stripes behind conventional line chart -
 20240625 Global warming across generations - warming stripes.svg
warming stripes juxtaposed with generations in history -
 Generation_timeline.svg
2020-, relevant to siming of different generations
_-_avg_above-_and_below-ice_readings.png)

.png)


Licensing
I, the copyright holder of this work, hereby publish it under the following license:
This file is licensed under the Creative Commons Attribution-Share Alike 4.0 International license.
- You are free:
- to share – to copy, distribute and transmit the work
- to remix – to adapt the work
- Under the following conditions:
- attribution – You must give appropriate credit, provide a link to the license, and indicate if changes were made. You may do so in any reasonable manner, but not in any way that suggests the licensor endorses you or your use.
- share alike – If you remix, transform, or build upon the material, you must distribute your contributions under the same or compatible license as the original.
File history
Click on a date/time to view the file as it appeared at that time.
| Date/Time | Thumbnail | Dimensions | User | Comment | |
|---|---|---|---|---|---|
| current | 05:05, 25 June 2024 | | 1,200 × 1,090 (20 KB) | RCraig09 | Uploaded own work with UploadWizard |
File usage
The following pages on the English Wikipedia use this file (pages on other projects are not listed):