
File:Circle area Monte Carlo integration2.svg

Size of this PNG preview of this SVG file: 600 × 600 pixels. Other resolutions: 240 × 240 pixels | 480 × 480 pixels | 768 × 768 pixels | 1,024 × 1,024 pixels | 2,048 × 2,048 pixels | 723 × 723 pixels.
Original file (SVG file, nominally 723 × 723 pixels, file size: 188 KB)
| This is a file from the Wikimedia Commons. Information from its description page there is shown below. Commons is a freely licensed media file repository. You can help. |
Summary
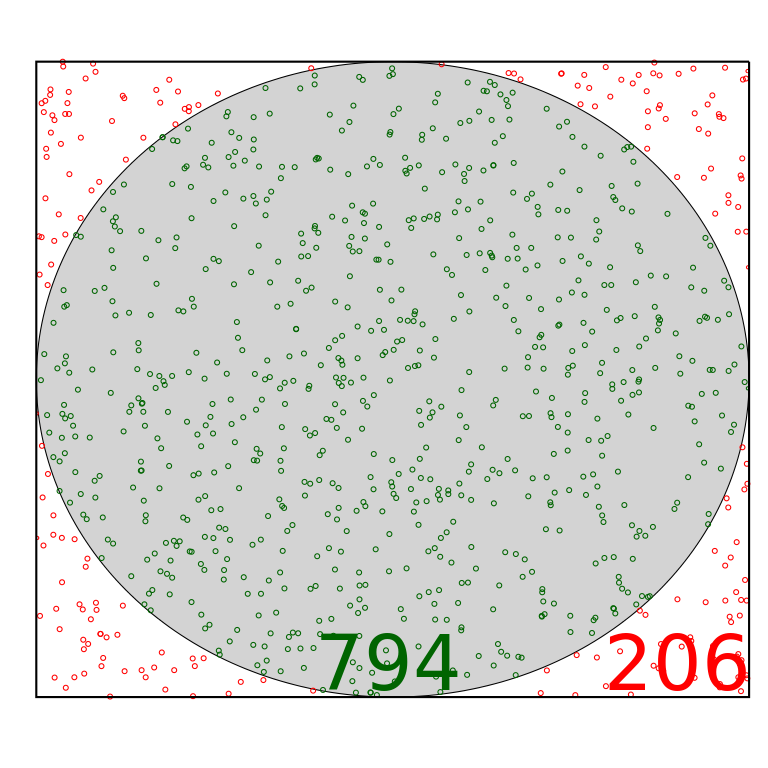
| Description | calculation of pi via monte carlo methods |
| Date | |
| Source | with R (source below) directly to SVG and the inkscape to polish it a bit (numbers) |
| Author | Thomas Steiner |
| Other versions |
|
| SVG development | |
| Source code | R code## for more about SVG, see eg http://www.stat.auckland.ac.nz/~paul/Talks/gridSVG/slide1.html
set.seed(20070209)
n<-1000
pts<-array(runif(2*n, min=-1,max=1),dim=c(n,2))
out <- pts[,1]^2+pts[,2]^2>1
ci<-seq(0,2*pi,length=300)
circle<-array(dim=c(300,2))
circle[,1]=cos(ci)
circle[,2]=sin(ci)
library(RSvgDevice)
devSVG("Circle_area_Monte_Carlo_integration2.svg", width=10, height=10)
plot(pts[out,],type="n",axes=F,xaxs="i",xlim=c(-1,1),ylim=c(-1,1),xlab="",ylab="")
polygon(circle,col="lightgray")
lines(pts[!out,],type="p",col="darkgreen")
lines(pts[out,],type="p",col="red")
lines(c(1,-1,-1,1,1),c(1,1,-1,-1,1),col="black",lwd=2)
text(x=0.8,y=-0.9,sum(out),col="red",cex=5)
text(x=0,y=-0.9,(n-sum(out)),col="darkgreen",cex=5)
#ev noch dazuschreiben, was der quotient ist?
4*(1-sum(out)/n)-pi
dev.off()
|


Licensing
This file is licensed under the Creative Commons Attribution-Share Alike 2.5 Generic license.
- You are free:
- to share – to copy, distribute and transmit the work
- to remix – to adapt the work
- Under the following conditions:
- attribution – You must give appropriate credit, provide a link to the license, and indicate if changes were made. You may do so in any reasonable manner, but not in any way that suggests the licensor endorses you or your use.
- share alike – If you remix, transform, or build upon the material, you must distribute your contributions under the same or compatible license as the original.
File history
Click on a date/time to view the file as it appeared at that time.
| Date/Time | Thumbnail | Dimensions | User | Comment | |
|---|---|---|---|---|---|
| current | 23:08, 9 February 2007 | | 723 × 723 (188 KB) | Thire | {{Information| |Description = calculation of pi via monte carlo methods |Source = with R (source below) directly to SVG and the inkscape to polish it a bit (numbers) |Date = 9 feb. 2007 |Author = Thomas Steiner |Permission = [[:de:B |
File usage
No pages on the English Wikipedia use this file (pages on other projects are not listed).
Global file usage
The following other wikis use this file:
- Usage on de.wikibooks.org