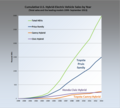
File:Cumulative US HEV Sales by year 1999 2009.png

Page contents not supported in other languages.
This is a file from the Wikimedia Commons
From Wikipedia, the free encyclopedia

Original file(948 × 862 pixels, file size: 81 KB, MIME type: image/png)

Summary

Description
English: Graph showing historical trend of cumulative sales of US hybrids series 1999-2014. Data series taken from Alternative Fuels and Advanced Vehicles Data Center (US DoE), available here. Graphic built using data in the provided excel file for "HEV Sales by Model". Edited with Excel and converted to PNG with Photoshop Elements.
Date (last updated 2014-01-16)
Source Own work using data from http://www.afdc.energy.gov/afdc/data/vehicles.html (US DoE).
Data for 2011 taken from HybridCars.com : http://www.hybridcars.com/news/december-2011-dashboard-sales-still-climbing-35093.html
Data for 2012 from: http://www.hybridcars.com/december-2012-dashboard/
Data for 2013 taken from: http://www.hybridcars.com/december-2013-dashboard/
Data for 2014 taken from: http://www.hybridcars.com/december-2014-dashboard/
Author Mariordo (Mario Roberto Durán Ortiz)
Permission
(Reusing this file)
Not required, data in the public domain (U.S. Government) & my own graphic work

Licensing

I, the copyright holder of this work, hereby publish it under the following license:
w:en:Creative Commons
attribution share alike
This file is licensed under the Creative Commons Attribution-Share Alike 3.0 Unported license.
You are free:
  • to share – to copy, distribute and transmit the work
  • to remix – to adapt the work
Under the following conditions:
  • attribution – You must give appropriate credit, provide a link to the license, and indicate if changes were made. You may do so in any reasonable manner, but not in any way that suggests the licensor endorses you or your use.
  • share alike – If you remix, transform, or build upon the material, you must distribute your contributions under the same or compatible license as the original.

Captions

Add a one-line explanation of what this file represents

Items portrayed in this file

depicts

13 March 2010

image/png

ae7829bf9bcc728d0437b1d1c19ac9c3cf57c1ca

83,333 byte

862 pixel

948 pixel

File history

Click on a date/time to view the file as it appeared at that time.

Date/TimeThumbnailDimensionsUserComment
current01:51, 22 January 2015Thumbnail for version as of 01:51, 22 January 2015948 × 862 (81 KB)MariordoUpdated to include HEV sales during 2014, same source.
21:06, 16 January 2014Thumbnail for version as of 21:06, 16 January 2014927 × 840 (148 KB)MariordoUpdated to include data through December 2013. Same sources
01:56, 4 October 2013Thumbnail for version as of 01:56, 4 October 2013940 × 846 (97 KB)MariordoSales figures were update through to September 2013
00:41, 7 April 2012Thumbnail for version as of 00:41, 7 April 2012887 × 706 (51 KB)MariordoAdded data for 2011. Source: HybridCars.com: http://www.hybridcars.com/news/december-2011-dashboard-sales-still-climbing-35093.html
18:31, 7 February 2011Thumbnail for version as of 18:31, 7 February 2011706 × 556 (43 KB)MariordoUpdated with 2010 sales, data taken from http://www.hybridcars.com/hybrid-clean-diesel-sales-dashboard/december-2010.html, to complete 1999-2010 historical series
00:57, 14 March 2010Thumbnail for version as of 00:57, 14 March 20101,481 × 1,159 (463 KB)Mariordo{{Information |Description={{en|1=Graph showing historical trend of cumulative sales of US hybrids series 1999-2009. Data series taken from Alternative Fuels and Advanced Vehicles Data Center (US DoE), available here [http://www.afdc.energy.gov/afdc/data/
The following pages on the English Wikipedia use this file (pages on other projects are not listed):

Global file usage

The following other wikis use this file:

Metadata