Jump to content

File:Effects of global warming, plotted against changes in global mean temperature.png

Page contents not supported in other languages.
This is a file from the Wikimedia Commons
From Wikipedia, the free encyclopedia

Original file(1,165 × 890 pixels, file size: 100 KB, MIME type: image/png)

Summary

Description
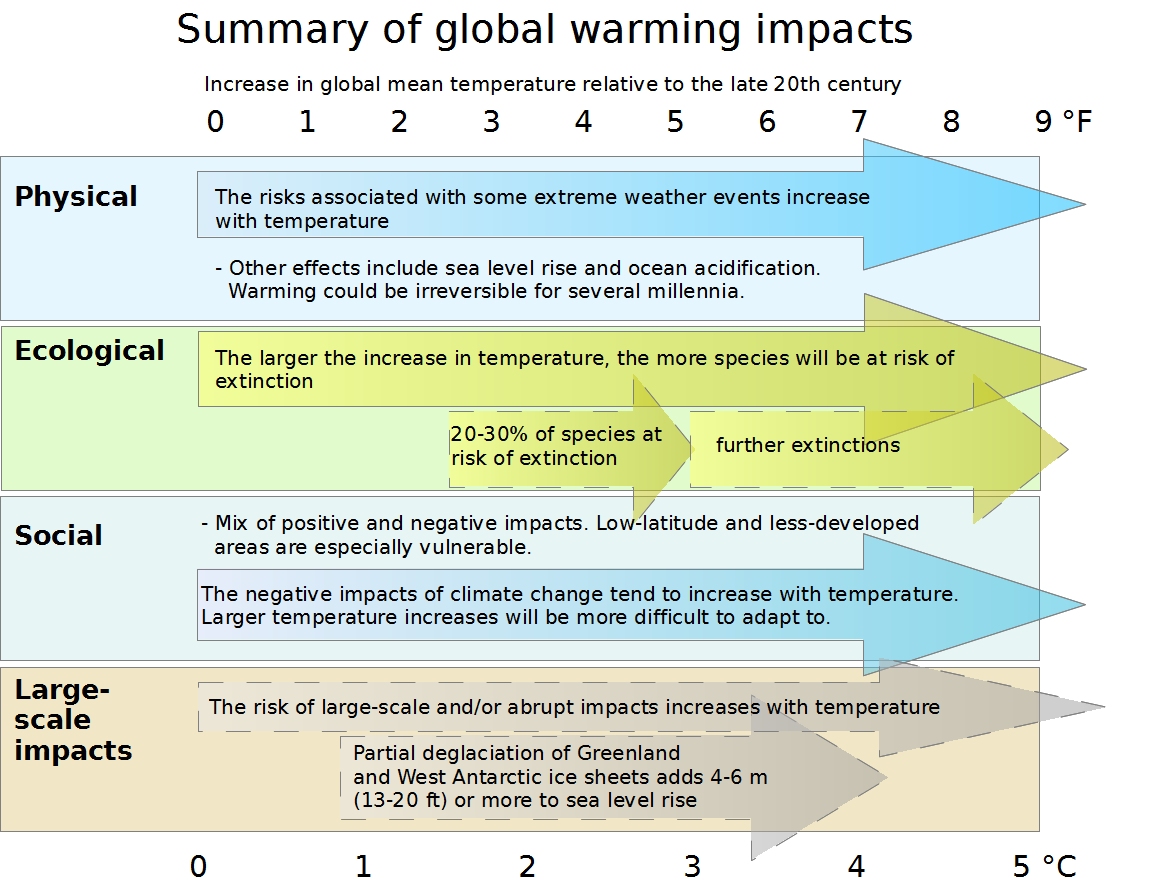
English: This diagram summarizes the effects of global warming. Impacts of climate change are plotted against changes in global mean temperature. Physical, ecological, social, and "large-scale" impacts are plotted against global mean temperature increases (above the 1980-1999 level) from 0 to 5 °C. Add 0.5 °C to measure impacts relative to pre-industrial temperatures.

The arrows on the diagram show that impacts tend to become more pronounced for higher magnitudes of warming. Solid arrows indicate that the projected impact is known with a high level of certainty, while dashed arrows indicate less certainty.

Physical impacts

Ecological impacts

  • The larger the increase in temperature, the more species will be at risk of extinction.[7]
  • 20-30% of species at risk of extinction (medium confidence) (1.5-2.5 °C / 2.7 – 4.5 °F)[8]
  • further extinctions (3 °C / 5.4 °F and above)[7]

Social impacts

  • Mix of positive and negative impacts.[9] Low-latitude, less-developed areas are especially vulnerable.[1]
  • The negative impacts of climate climate change tend to increase with temperature.[9] Larger temperature increases will be more difficult to adapt to.[10]

Large-scale impacts

Notes

The following abbreviations are used: IPCC Third Assessment Report = TAR; IPCC Fourth Assessment Report = AR4

  1. a b c Schneider, S.H., et al. ((Please provide a date))“Ch 19: Assessing Key Vulnerabilities and the Risk from Climate Change”, in Sec 19.3.7. Update on 'Reasons for Concern'[1], archived from the original on 2013-03-12, in IPCC AR4 WG2 2007
  2. a b Smith & others 2009
  3. White, K.S., et al. ((Please provide a date))“Technical summary”, in Sec 7.2.4. Extreme Weather Events[2], archived from the original on 2014-04-16, in IPCC TAR WG2 2001, p. 54
  4. Ch 5: Projections of Sea-Level Change[3], (Please provide a date or year), in US NRC 2012, p. 83
  5. Summary[4], (Please provide a date or year), in US NRC 2010, p. 5
  6. Solomon & others 2009
  7. a b Schneider, S.H., et al. ((Please provide a date))“Ch 19: Assessing Key Vulnerabilities and the Risk from Climate Change”, in Sec 19.3.4 Ecosystems and biodiversity[5], archived from the original on 2018-11-28, in IPCC AR4 WG2 2007
  8. “Synthesis report”, in Ecosystems, in: Sec 3.3.1 Impacts on systems and sectors[6], (Please provide a date or year), archived from the original on 2018-11-03, in IPCC AR4 SYR 2007
  9. a b Parry, M.L., et al. ((Please provide a date))“Technical summary”, in Industry, settlement and society, in: Box TS.5. The main projected impacts for systems and sectors[7], archived from the original on 2018-11-02, in IPCC AR4 WG2 2007
  10. Schneider, S.H., et al. ((Please provide a date))“Ch 19: Assessing Key Vulnerabilities and the Risk from Climate Change”, in Executive summary[8], archived from the original on 2010-05-02, in IPCC AR4 WG2 2007
  11. IPCC ((Please provide a date))“Summary for Policymakers”, in Sec. 2.6. The Potential for Large-Scale and Possibly Irreversible Impacts Poses Risks that have yet to be Reliably Quantified[9], archived from the original on 2015-09-24, in IPCC TAR WG2 2001

References

  • IPCC TAR WG2 (2001), McCarthy, J. J.; Canziani, O. F.; Leary, N. A.; Dokken, D. J.; and White, K. S., editor, Climate Change 2001: Impacts, Adaptation and Vulnerability (Contribution of Working Group II (WG2) to the Third Assessment Report of the Intergovernmental Panel on Climate Change)[10], Cambridge University Press, ISBN 0-521-80768-9, archived from the original on 2016-05-14 (pb: ISBN 0-521-01500-6).
  • IPCC AR4 WG2 (2007), Parry, M.L.; Canziani, O.F.; Palutikof, J.P.; van der Linden, P.J.; and Hanson, C.E., editor, Climate Change 2007: Impacts, Adaptation and Vulnerability (Contribution of Working Group II to the Fourth Assessment Report of the Intergovernmental Panel on Climate Change)[11], Cambridge University Press, ISBN 978-0-521-88010-7, archived from the original on 2018-11-10 (pb: ISBN 978-0-521-70597-4).
  • IPCC AR4 SYR (2007), Core Writing Team; Pachauri, R.K; and Reisinger, A., editor, Climate Change 2007: Synthesis Report (SYR) (Contribution of Working Groups I, II and III to the Fourth Assessment Report of the Intergovernmental Panel on Climate Change)[12], en:Geneva, en:Switzerland: IPCC, ISBN 92-9169-122-4.
  • Smith, J., et al. (Mar 2009), “Assessing dangerous climate change through an update of the Intergovernmental Panel on Climate Change (IPCC) "reasons for concern"”, in Proceedings of the National Academy of Sciences of the United States of America[13], volume 106, issue 11, Bibcode2009PNAS..106.4133S, DOI:10.1073/pnas.0812355106, ISSN 0027-8424, PMID 19251662, pages 4133–4137
  • Solomon, S., et al. (2009-01-28), “Irreversible climate change due to carbon dioxide emissions”, in Proceedings of the National Academy of Sciences of the United States of America (PNAS)[14], volume 106, issue 6, US National Academy of Sciences, Bibcode2009PNAS..106.1704S, DOI:10.1073/pnas.0812721106, PMID 19179281, page 1704
  • US NRC (2010) Ocean Acidification: A National Strategy to Meet the Challenges of a Changing Ocean. A report by the US National Research Council (US NRC)[15], Washington, D.C., USA: National Academies Press, ISBN 978-0-309-15359-1
  • US NRC (2012) Sea-Level Rise for the Coasts of California, Oregon, and Washington: Past, Present, and Future. A report by the US National Research Council (US NRC)[16], Washington, D.C., USA: National Academies Press, ISBN 978-0-309-25594-3
Date
Source Own work
Author Enescot

Licensing

I, the copyright holder of this work, hereby publish it under the following license:
Creative Commons CC-Zero This file is made available under the Creative Commons CC0 1.0 Universal Public Domain Dedication.
The person who associated a work with this deed has dedicated the work to the public domain by waiving all of their rights to the work worldwide under copyright law, including all related and neighboring rights, to the extent allowed by law. You can copy, modify, distribute and perform the work, even for commercial purposes, all without asking permission.

Captions

Add a one-line explanation of what this file represents

Items portrayed in this file

depicts

9 November 2012

image/png

File history

Click on a date/time to view the file as it appeared at that time.

Date/TimeThumbnailDimensionsUserComment
current09:21, 28 May 2013Thumbnail for version as of 09:21, 28 May 20131,165 × 890 (100 KB)Enescotchanged text: "developing countries are most vulnerable to negative impacts" to "Low-latitude and less-developed areas are especially vulnerable". Other minor changes
05:49, 23 November 2012Thumbnail for version as of 05:49, 23 November 20121,126 × 890 (112 KB)EnescotAdded title and Fahrenheit/Celsius temperature scales. Revised text for clarity and to make it more consistent with the cited sources. Changed colors.
04:08, 14 November 2012Thumbnail for version as of 04:08, 14 November 20121,107 × 784 (98 KB)EnescotAs per discussion on en:Talk:Effects of global warming#Burning embers diagram, revised image to emphasize that some risks increase with global warming.
04:53, 9 November 2012Thumbnail for version as of 04:53, 9 November 2012717 × 524 (44 KB)Enescot{{Information |Description ={{en|1=This diagram shows the effects of global warming, plotted against changes in global mean temperature (draft version for discussion on en:Talk:Effects of global warming#Burning embers diagram). It is largely ba...
The following pages on the English Wikipedia use this file (pages on other projects are not listed):

Global file usage

The following other wikis use this file:

Metadata