
File:Logarithmic functions.svg

Size of this PNG preview of this SVG file: 600 × 480 pixels. Other resolutions: 300 × 240 pixels | 960 × 768 pixels | 1,280 × 1,024 pixels | 2,560 × 2,048 pixels.
Original file (SVG file, nominally 600 × 480 pixels, file size: 27 KB)
| This is a file from the Wikimedia Commons. Information from its description page there is shown below. Commons is a freely licensed media file repository. You can help. |
Summary
| Description |
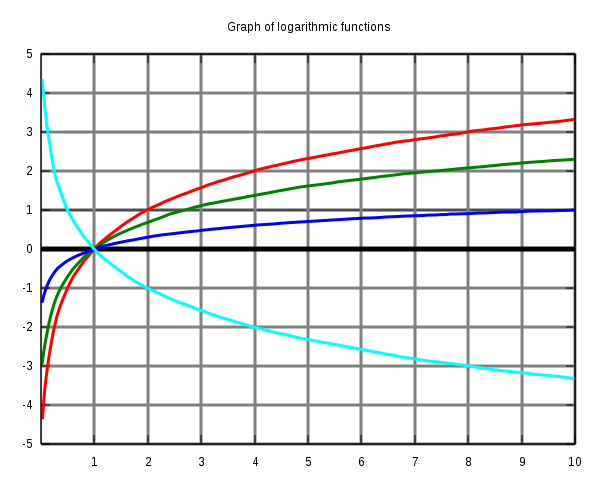
Graph of logarithmic functions in SVG-format. Red is log(x) base 2. Green is ln(x) (log(x) base e). Blue is log(x) base 10. Cyan is log(x) base 0.5.
set terminal svg set output "logarithm.svg" set title "Graph of logarithmic functions" set xrange [0:10] set yrange [-5:5] set xtics 1,1,10 set ytics -5,1,5 set grid linewidth 3 set xzeroaxis linewidth 5 plot log10(x)/log10(2) notitle with lines linewidth 3, log(x) notitle with lines linewidth 3, log10(x) notitle with lines linewidth 3, log10(x)/log10(0.5) notitle with lines linewidth 3 show output |
| Date | |
| Source | Own work |
| Author | Christoffer Stausland |
Licensing
I, the copyright holder of this work, hereby publish it under the following licenses:

|
Permission is granted to copy, distribute and/or modify this document under the terms of the GNU Free Documentation License, Version 1.2 or any later version published by the Free Software Foundation; with no Invariant Sections, no Front-Cover Texts, and no Back-Cover Texts. A copy of the license is included in the section entitled GNU Free Documentation License. |
| This file is licensed under the Creative Commons Attribution-Share Alike 3.0 Unported license. | ||
| ||
| This licensing tag was added to this file as part of the GFDL licensing update. |
This file is licensed under the Creative Commons Attribution-Share Alike 2.5 Generic, 2.0 Generic and 1.0 Generic license.
- You are free:
- to share – to copy, distribute and transmit the work
- to remix – to adapt the work
- Under the following conditions:
- attribution – You must give appropriate credit, provide a link to the license, and indicate if changes were made. You may do so in any reasonable manner, but not in any way that suggests the licensor endorses you or your use.
- share alike – If you remix, transform, or build upon the material, you must distribute your contributions under the same or compatible license as the original.
You may select the license of your choice.
File history
Click on a date/time to view the file as it appeared at that time.
| Date/Time | Thumbnail | Dimensions | User | Comment | |
|---|---|---|---|---|---|
| current | 13:22, 11 April 2007 | | 600 × 480 (27 KB) | Chrtsta | == Summary == {{Information |Description= Graph of logarithmic functions in SVG-format. Red is log(x) base 1.7. Green is log(x) base 2. Blue is ln(x) (log(x) base e). Cyan is log(x) base 0.5. I made this graph in gnuplot (post-processed using Inkscape) |
| 23:24, 26 March 2007 |  | 597 × 396 (29 KB) | Dicklyon | Improve it by hand. Use base 10 in place of base 1.7. | |
| 14:32, 17 March 2007 |  | 600 × 480 (25 KB) | Chrtsta | == Summary == {{Information |Description= Graph of logarithmic functions in SVG-format. Red is log(x) base 1.7. Green is log(x) base 2. Blue is ln(x) (log(x) base e). Cyan is log(x) base 0.5. I made this graph in gnuplot (it is post-processed using Ink | |
| 20:40, 16 March 2007 |  | 600 × 480 (18 KB) | Chrtsta | Graph of logarithmic functions Red is log(x) base 1.7. Green is log(x) base 2. Blue is ln(x) (log(x) base e). Cyan is log(x) base 0.5. I made this graph in gnuplot, with these instructions: set terminal svg set output "logarithm.svg" set title "Graph o |
File usage
No pages on the English Wikipedia use this file (pages on other projects are not listed).
Global file usage
The following other wikis use this file:
- Usage on fi.wiktionary.org
- Usage on nn.wikipedia.org
- Usage on no.wikipedia.org
- Usage on pl.wikipedia.org