Jump to content

File:NetRevenue2004Cartogram.png

Page contents not supported in other languages.
This is a file from the Wikimedia Commons
From Wikipedia, the free encyclopedia

Original file(1,693 × 908 pixels, file size: 181 KB, MIME type: image/png)

Summary

Description
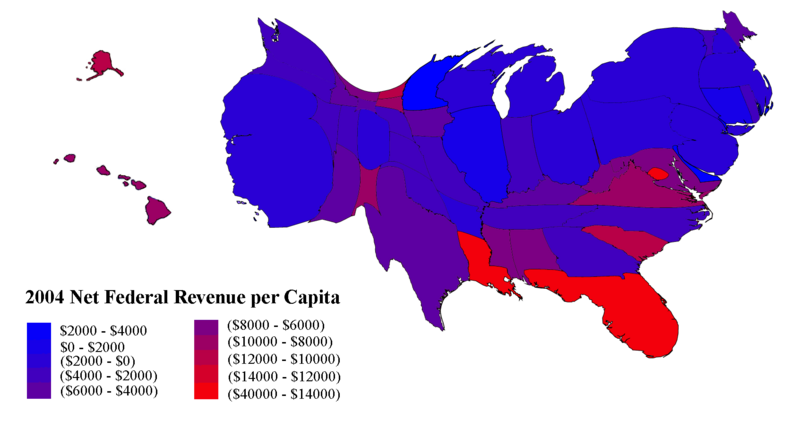
English: Choropleth of net federal income per capita in the United States displayed on a state-population cartogram (2004). The United States average net revenue per capita is a deficit, ($3898.46).
Date
Source

I copied the cartogram shape from a figure Michael Gastner et al. [1] released under CC-BY 2.0 license. Michael Gastner's name must accompany this figure in compliance with CC-BY 2.0. The U.S. Census Bureau website hosts an estimate of 2004 population [2] and the 2004 consolidated federal funds report [3]. I obtained IRS state records from [4].

A MatLab script summed the total expenditures and obligations, direct loans, guaranteed loans, and insurance from the consolidated federal funds report for each state. The funds were subtracted from the IRS revenue to obtain a net income per state, which yielded a per capita net income when divided by 2004 estimated populations. Territories beyond the 50 states and the District of Columbia, along with funding not collected through the IRS, are not considered in this figure. The cartogram sizes of Alaska and Hawaii could be off by, say, 5-10% because I copied them from a lower resolution image by dead reckoning.
Author David Liao

Licensing

I, the copyright holder of this work, hereby publish it under the following license:
w:en:Creative Commons
attribution share alike
This file is licensed under the Creative Commons Attribution-Share Alike 3.0 Unported, 2.5 Generic, 2.0 Generic and 1.0 Generic license.
You are free:
  • to share – to copy, distribute and transmit the work
  • to remix – to adapt the work
Under the following conditions:
  • attribution – You must give appropriate credit, provide a link to the license, and indicate if changes were made. You may do so in any reasonable manner, but not in any way that suggests the licensor endorses you or your use.
  • share alike – If you remix, transform, or build upon the material, you must distribute your contributions under the same or compatible license as the original.

Captions

Add a one-line explanation of what this file represents

Items portrayed in this file

depicts

19 August 2007

File history

Click on a date/time to view the file as it appeared at that time.

Date/TimeThumbnailDimensionsUserComment
current19:27, 7 December 2012Thumbnail for version as of 19:27, 7 December 20121,693 × 908 (181 KB)Citypeekremoval watermark
19:46, 19 August 2007Thumbnail for version as of 19:46, 19 August 20071,693 × 908 (212 KB)Magneticcarpet
19:36, 19 August 2007Thumbnail for version as of 19:36, 19 August 20071,693 × 908 (206 KB)Magneticcarpet{{Information |Description=Choropleth of net federal income per capita in the United States displayed on a state-population cartogram (2004). The United States average net revenue per capita is a deficit, ($3898.46). |Source=I copied the cartogram shap
No pages on the English Wikipedia use this file (pages on other projects are not listed).

Global file usage

The following other wikis use this file:

Metadata