
File:PIA21210 - Satellite Radar Show Complex Set of Faults Moved in 2016 New Zealand Earthquake.jpg

Original file (4,481 × 2,682 pixels, file size: 1.15 MB, MIME type: image/jpeg)
| This is a file from the Wikimedia Commons. Information from its description page there is shown below. Commons is a freely licensed media file repository. You can help. |
Summary
| Description |
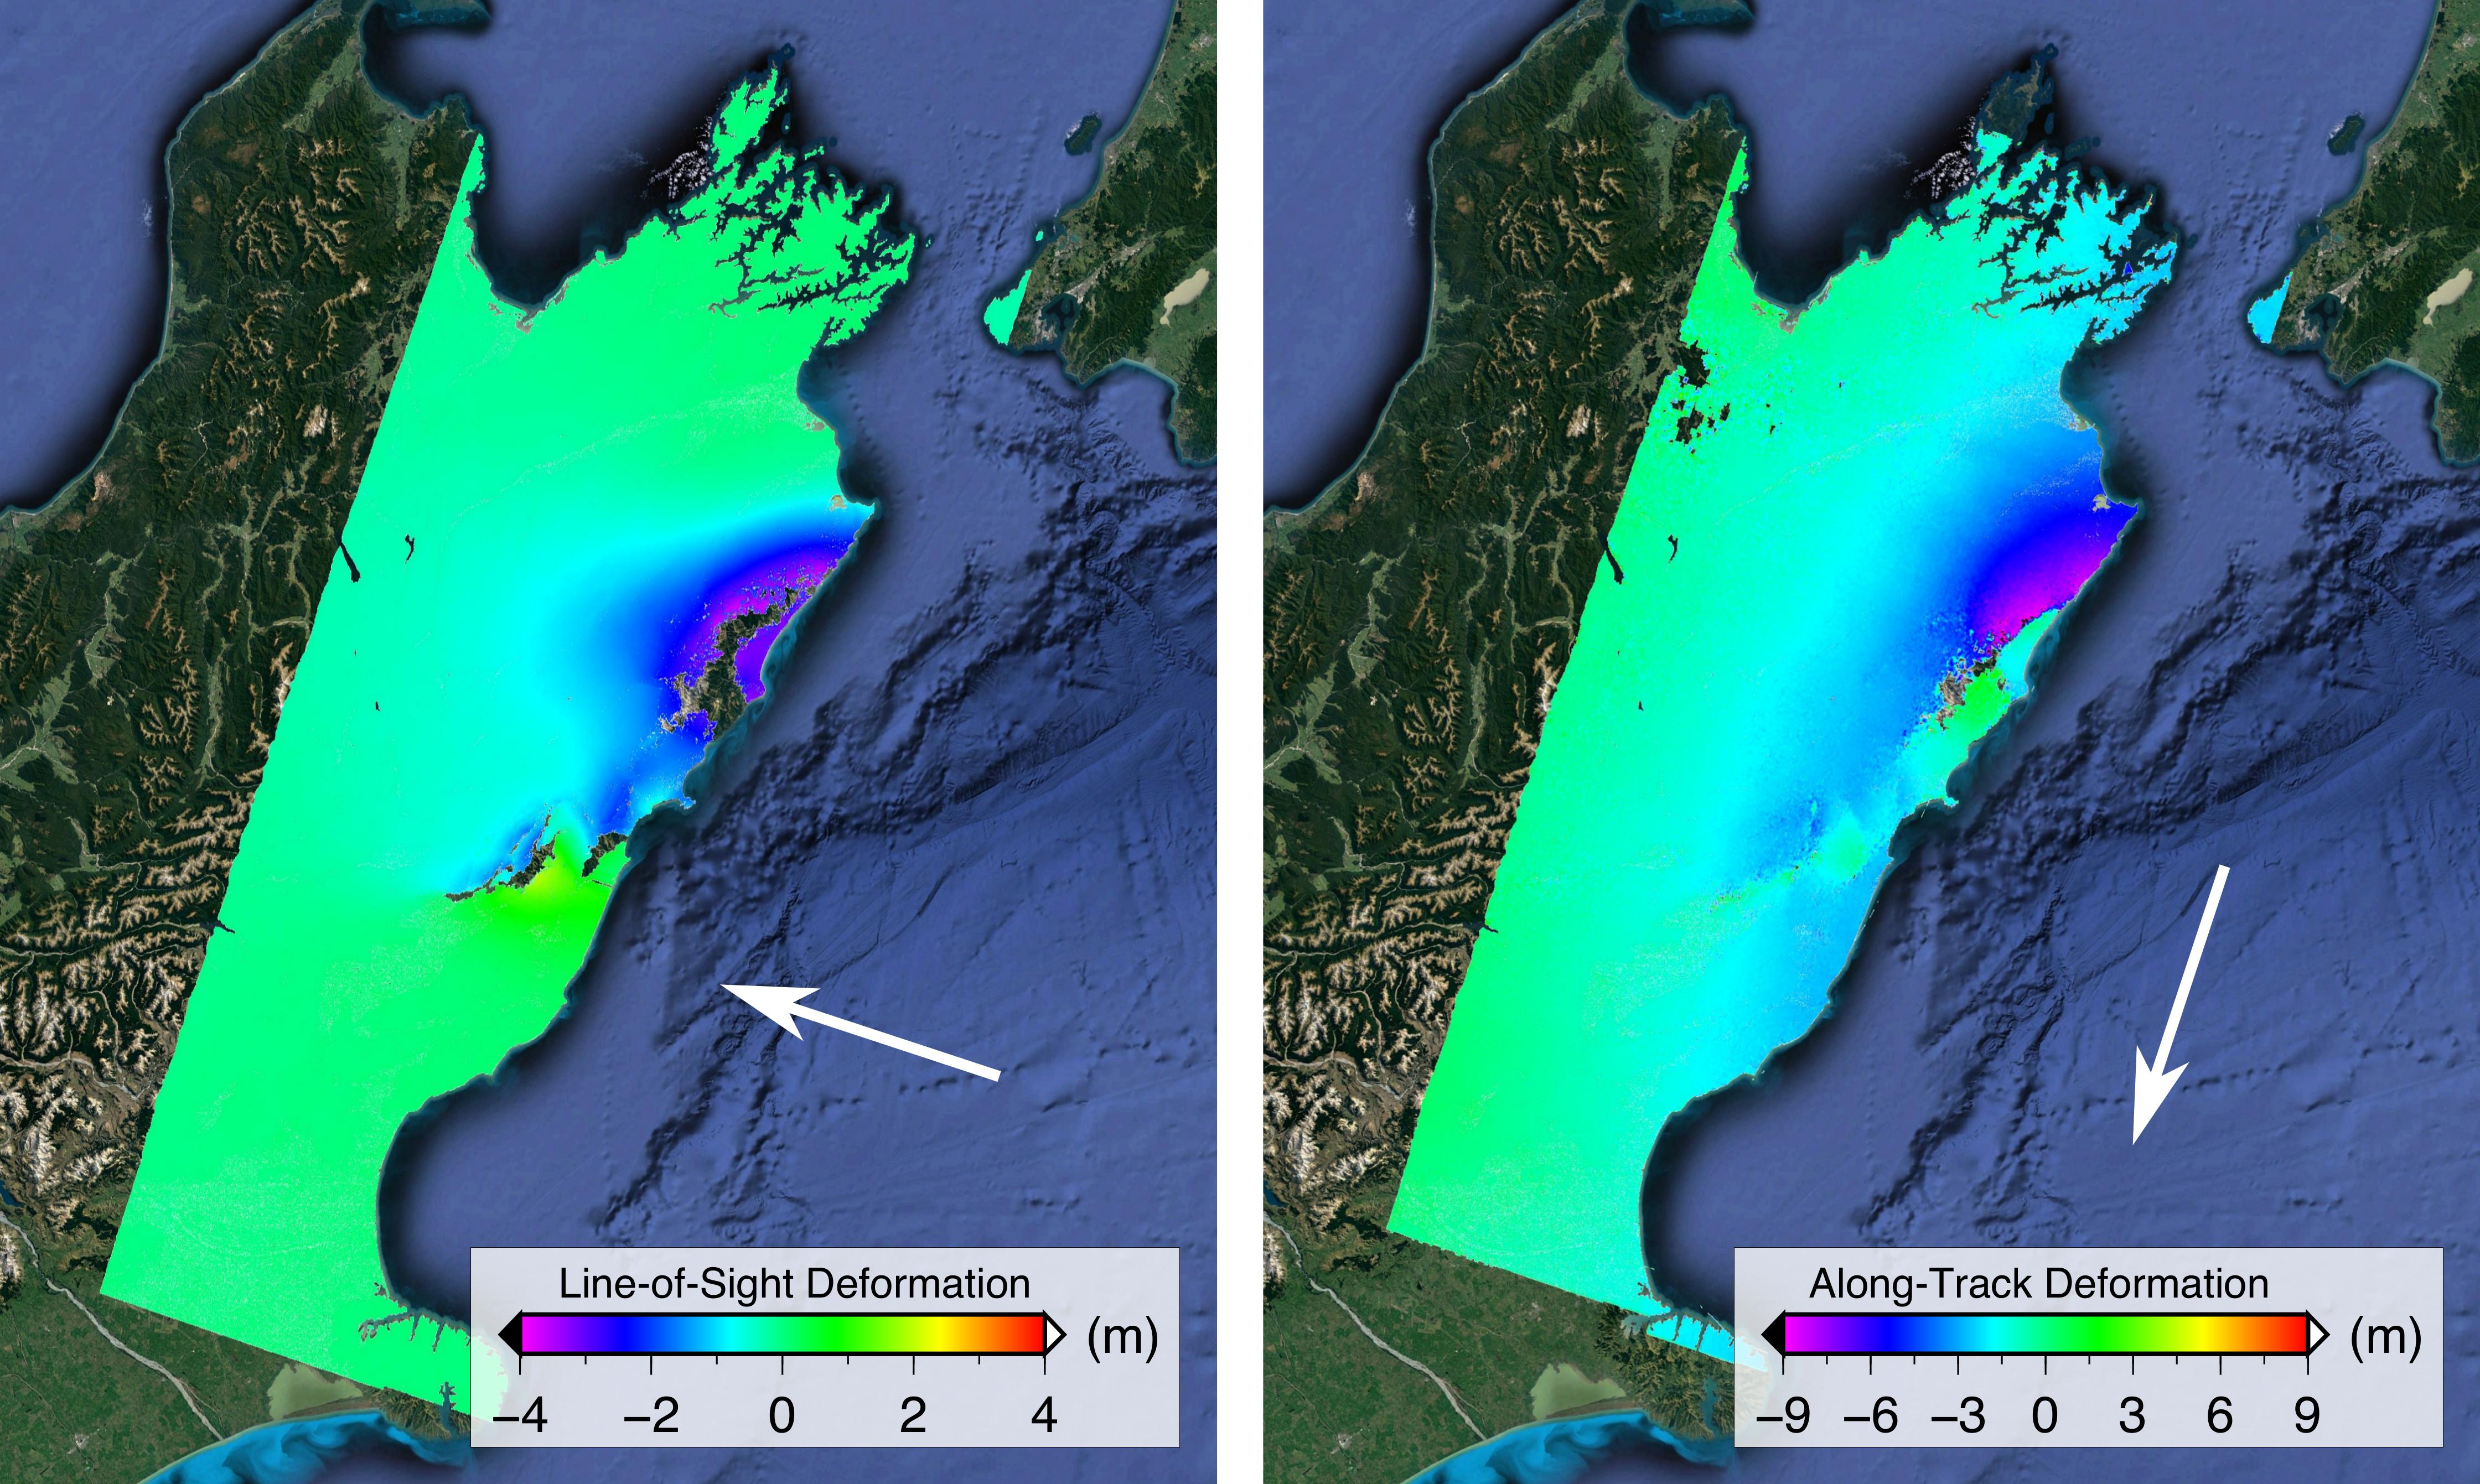
English: NASA and its partners are contributing important observations and expertise to the ongoing response to the Nov. 14, 2016, magnitude 7.8 Kaikoura earthquake in New Zealand. This shallow earthquake was so complex and unusual, it is likely to change how scientists think about earthquake hazards in plate boundary zones around the world.
Scientists with the Advanced Rapid Imaging and Analysis project (ARIA), a collaboration between NASA's Jet Propulsion Laboratory, Pasadena, California, and Caltech in Pasadena, analyzed interferometric synthetic aperture radar images from the PALSAR-2 instrument on the ALOS-2 satellite operated by the Japan Aerospace Exploration Agency (JAXA) to calculate maps of the deformation of Earth's surface caused by the quake. Two maps show motion of the surface in two different directions. Each false-color map shows the amount of permanent surface movement caused almost entirely by the earthquake, as viewed by the satellite, during a 28-day interval between two ALOS-2 wide-swath images acquired on Oct. 18 and Nov. 15, 2016. In these two new maps made from the wide-swath images, the colors of the surface displacements are proportional to the surface motion. The wide-swath images cover the entire 106-mile (170-kilometer) length of the complex set of earthquake ruptures. The arrows show the direction of the radar motion measurement. In the left image, the blue and purple tones show the areas where the land around the Kaikoura peninsula in the Marlborough region of New Zealand's South Island has moved toward the satellite by up to 13.2 feet (4 meters), both eastward and upward. In the right image, the blue and purple tones show the areas that moved to the north by up to 30 feet (9 meters) and green tones show the area that moved to the south. The sharp line of color change is across the Kekerengu Fault, which had the largest amount of motion in the earthquake. Field studies found maximum rupture at the surface was measured at 39 feet (12 meters) of horizontal displacement. Several other faults have sharp color changes due to smaller amounts of motion, with a total of at least 12 faults rupturing in this single large earthquake. Areas without color have snow, heavy vegetation or open water that prevents the radar measurements from being coherent between satellite images -- a required condition to measure ground displacement. Scientists use these maps to build detailed models of the fault slip at depth and associated land movements to better understand the impact on future earthquake activity. The PALSAR-2 data were provided by JAXA through the Committee on Earth Observation Satellites (CEOS) and through scientific research projects. The background image is from Google Earth. |
| Date | 18 October, 15 November 2016 (published 23 March 2017) |
| Source | Catalog page · Full-res (JPEG · TIFF) |
| Author | NASA/JPL-Caltech/JAXA/Google Earth |
| Camera location | | View this and other nearby images on: OpenStreetMap |
|---|
This image or video was catalogued by Jet Propulsion Laboratory of the United States National Aeronautics and Space Administration (NASA) under Photo ID: PIA21210. This tag does not indicate the copyright status of the attached work. A normal copyright tag is still required. See Commons:Licensing. Other languages:
|
| This media is a product of the Advanced Land Observing Satellite 2 (ALOS-2) mission Credit and attribution belongs to the mission team, if not already specified in the "author" row |
Licensing
| This file is in the public domain in the United States because it was solely created by NASA. NASA copyright policy states that "NASA material is not protected by copyright unless noted". (See Template:PD-USGov, NASA copyright policy page or JPL Image Use Policy.) | ||
 |
Warnings:
|
File history
Click on a date/time to view the file as it appeared at that time.
| Date/Time | Thumbnail | Dimensions | User | Comment | |
|---|---|---|---|---|---|
| current | 21:52, 27 March 2017 | | 4,481 × 2,682 (1.15 MB) | PhilipTerryGraham | User created page with UploadWizard |
File usage
Global file usage
The following other wikis use this file:
- Usage on pl.wikipedia.org
- Usage on ru.wikipedia.org