
File:Spectrumgstring.jpg
No higher resolution available.
Spectrumgstring.jpg (699 × 477 pixels, file size: 57 KB, MIME type: image/jpeg)
| This is a file from the Wikimedia Commons. Information from its description page there is shown below. Commons is a freely licensed media file repository. You can help. |
Summary
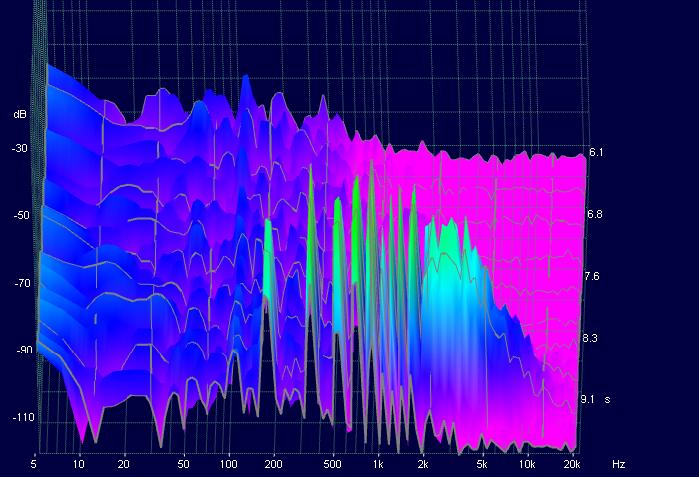
| Description | A 3D sound spectrum analysis of a violin's G String using the OscilloMeter program. x=the frequency of pitch, y=the volume, and z=time. Observe the peaks at the foreground. The other low points are background noise. The interesting thing is that the pitch that we hear is the peak at around 200h, but the other peaks are overtones that contribute to the sound, greatly outnumbering the original pitch. You can make out the overtone series for the note G. |
| Date | |
| Source | Own work |
| Author | Justoys |
Licensing
| I, the copyright holder of this work, release this work into the public domain. This applies worldwide. In some countries this may not be legally possible; if so: I grant anyone the right to use this work for any purpose, without any conditions, unless such conditions are required by law. |
File history
Click on a date/time to view the file as it appeared at that time.
| Date/Time | Thumbnail | Dimensions | User | Comment | |
|---|---|---|---|---|---|
| current | 18:53, 28 April 2009 | | 699 × 477 (57 KB) | Justoys~commonswiki | {{Information |Description=A 3D sound spectrum analysis of a violin's G String using the OscilloMeter program. x=the frequency of pitch, y=the volume, and z=time. Observe the peaks at the foreground. The other low points are background noise. The interest |
File usage
The following pages on the English Wikipedia use this file (pages on other projects are not listed):
Global file usage
The following other wikis use this file:
- Usage on bn.wikibooks.org
- Usage on el.wikipedia.org
- Usage on nl.wikipedia.org