
File:US Adult Incarceration Rate by State.svg

Original file (SVG file, nominally 960 × 600 pixels, file size: 62 KB)
| This is a file from the Wikimedia Commons. Information from its description page there is shown below. Commons is a freely licensed media file repository. You can help. |
This file is translated using SVG <switch> elements. All translations are stored in the same file! Learn more.
For most Wikipedia projects, you can embed the file normally (without a To translate the text into your language, you can use the SVG Translate tool. Alternatively, you can download the file to your computer, add your translations using whatever software you're familiar with, and re-upload it with the same name. You will find help in Graphics Lab if you're not sure how to do this. |
Summary
| Description |
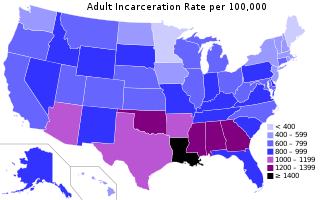
English: A visual representation of states in the United States by the adult rate of incarceration on December 31, 2013. It includes sentenced and unsentenced inmates in jails and state prisons, but not persons in federal prisons. Data is from Appendix Table 1 in the PDF for Correctional Populations In The United States, 2013. See also: List of U.S. states by incarceration rate. |
| Date | |
| Source | Own work |
| Author | Delphi234 |

|
This file may be updated to reflect new information. If you wish to use a specific version of the file without new updates being mirrored, please upload the required version as a separate file. |
Data
| Jurisdiction | Adults in prison or jail |
Incarceration rate per 100,000 adults |
|---|---|---|
| State | 2,012,400 | 830 |
| Federal | 215,100 | 90 |
| U.S. total | 2,227,500 | 910 |
Chart below has numbers for people in adult facilities, and for people on probation and on parole. The incarceration numbers in the main part of the chart below are for sentenced and unsentenced inmates in local jails and state prisons, but not for people in federal prisons.
The bottom of the chart has totals and average rates for each column.
Federal prison numbers are added at the end of the chart. So the total number (local, state, and federal) under adult correctional supervision is 6,906,200. That is a correctional supervision rate of 2,830 per 100,000 U.S. adult residents. That rounds off to 2.8% of US adult residents.
| Jurisdiction | Total | Community supervision | Incarcerated | |||
|---|---|---|---|---|---|---|
| Total, 12/31/2013 |
Rate per 100,000 adults |
Probation or Parole, 12/31/2013 |
Rate per 100,000 adults |
In prison or jail, 12/31/2013 |
Rate per 100,000 adults | |
| Alabama | 115,600 | 3,100 | 70,800 | 1,900 | 46,000 | 1,230 |
| Alaska | 14,600 | 2,670 | 9,500 | 1,730 | 5,100 | 940 |
| Arizona | 132,300 | 2,620 | 79,200 | 1,570 | 55,200 | 1,090 |
| Arkansas | 69,900 | 3,100 | 50,200 | 2,220 | 22,800 | 1,010 |
| California | 600,400 | 2,050 | 381,600 | 1,300 | 218,800 | 750 |
| Colorado | 120,700 | 2,970 | 89,700 | 2,210 | 32,100 | 790 |
| Connecticut | 62,900 | 2,230 | 45,400 | 1,610 | 17,600 | 620 |
| Delaware | 23,700 | 3,260 | 16,700 | 2,300 | 7,000 | 960 |
| District of Columbia | 13,700 | 2,540 | 12,600 | 2,330 | 2,400 | 450 |
| Florida | 389,400 | 2,490 | 237,800 | 1,520 | 154,500 | 990 |
| Georgia | 624,200 | 8,290 | 536,200 | 7,120 | 91,600 | 1,220 |
| Hawaii | 28,900 | 2,630 | 23,300 | 2,120 | 5,600 | 510 |
| Idaho | 45,500 | 3,820 | 35,200 | 2,960 | 10,200 | 860 |
| Illinois | 222,700 | 2,250 | 153,400 | 1,550 | 69,300 | 700 |
| Indiana | 179,400 | 3,580 | 134,000 | 2,680 | 45,400 | 910 |
| Iowa | 45,900 | 1,930 | 34,700 | 1,460 | 12,700 | 530 |
| Kansas | 37,100 | 1,710 | 20,500 | 940 | 16,600 | 760 |
| Kentucky | 97,600 | 2,880 | 65,900 | 1,940 | 32,100 | 950 |
| Louisiana | 115,700 | 3,280 | 70,700 | 2,010 | 50,100 | 1,420 |
| Maine | 10,500 | 980 | 6,700 | 630 | 3,800 | 350 |
| Maryland | 74,800 | 1,620 | 46,300 | 1,010 | 32,700 | 710 |
| Massachusetts | 91,100 | 1,710 | 70,000 | 1,310 | 21,400 | 400 |
| Michigan | 253,700 | 3,310 | 195,200 | 2,550 | 60,200 | 790 |
| Minnesota | 123,500 | 2,970 | 107,800 | 2,590 | 15,700 | 380 |
| Mississippi | 67,400 | 2,980 | 38,600 | 1,710 | 28,800 | 1,270 |
| Missouri | 114,900 | 2,460 | 70,400 | 1,510 | 44,500 | 950 |
| Montana | 14,800 | 1,870 | 9,500 | 1,190 | 6,000 | 760 |
| Nebraska | 23,200 | 1,640 | 14,800 | 1,050 | 8,500 | 600 |
| Nevada | 37,500 | 1,750 | 17,600 | 820 | 19,900 | 930 |
| New Hampshire | 11,100 | 1,050 | 6,300 | 590 | 4,800 | 460 |
| New Jersey | 164,100 | 2,380 | 128,100 | 1,860 | 37,600 | 540 |
| New Mexico | 34,200 | 2,170 | 18,700 | 1,180 | 15,500 | 980 |
| New York | 228,100 | 1,470 | 151,400 | 980 | 81,400 | 530 |
| North Carolina | 156,000 | 2,050 | 100,600 | 1,320 | 55,300 | 730 |
| North Dakota | 8,100 | 1,430 | 5,500 | 960 | 2,700 | 470 |
| Ohio | 335,500 | 3,750 | 267,400 | 2,990 | 69,800 | 780 |
| Oklahoma | 67,700 | 2,320 | unk | unk | 37,900 | 1,300 |
| Oregon | 84,100 | 2,720 | 61,100 | 1,980 | 22,900 | 740 |
| Pennsylvania | 355,600 | 3,530 | 275,800 | 2,730 | 85,500 | 850 |
| Rhode Island | 24,600 | 2,930 | 23,400 | 2,790 | 3,400 | 400 |
| South Carolina | 73,500 | 1,980 | 40,900 | 1,100 | 32,600 | 880 |
| South Dakota | 14,800 | 2,310 | 9,500 | 1,490 | 5,300 | 820 |
| Tennessee | 122,500 | 2,440 | 77,900 | 1,550 | 48,100 | 960 |
| Texas | 711,900 | 3,640 | 508,000 | 2,600 | 221,800 | 1,130 |
| Utah | 25,200 | 1,250 | 14,500 | 720 | 12,500 | 620 |
| Vermont | 8,600 | 1,710 | 6,900 | 1,370 | 2,100 | 410 |
| Virginia | 114,600 | 1,780 | 55,800 | 870 | 58,800 | 910 |
| Washington | 139,200 | 2,570 | 111,100 | 2,060 | 29,700 | 550 |
| West Virginia | 20,500 | 1,390 | 11,000 | 750 | 9,700 | 660 |
| Wisconsin | 98,100 | 2,200 | 65,300 | 1,470 | 34,800 | 780 |
| Wyoming | 9,700 | 2,180 | 6,000 | 1,340 | 3,800 | 840 |
| State | 6,559,200 | 2,690 | 4,619,400 | 1,900 | 2,012,400 | 830 |
| Federal | 347,000 | 140 | 131,900 | 50 | 215,100 | 90 |
| U.S. total | 6,906,200 | 2830 | 4,751,400 | 1950 | 2,227,500 | 910 |
Licensing
- You are free:
- to share – to copy, distribute and transmit the work
- to remix – to adapt the work
- Under the following conditions:
- attribution – You must give appropriate credit, provide a link to the license, and indicate if changes were made. You may do so in any reasonable manner, but not in any way that suggests the licensor endorses you or your use.
- share alike – If you remix, transform, or build upon the material, you must distribute your contributions under the same or compatible license as the original.
File history
Click on a date/time to view the file as it appeared at that time.
| Date/Time | Thumbnail | Dimensions | User | Comment | |
|---|---|---|---|---|---|
| current | 11:16, 31 October 2020 | | 960 × 600 (62 KB) | Xesau | Updated Dutch (nl) translation |
| 01:33, 26 November 2019 |  | 960 × 600 (64 KB) | DHN | Updated Vietnamese translation | |
| 18:21, 20 January 2017 |  | 960 × 600 (64 KB) | Sascha GPD | german translation | |
| 21:01, 18 July 2016 |  | 960 × 600 (64 KB) | Timeshifter | Color substitutions: 1000-1199 range. 3 states: Replaced #0000cc with mediumorchid. 1200-1399 range. 4 states: Replaced #000087 with purple. 1400 plus range. 1 state: Replaced #000033 with black. Without these changes I am unable to distinguish between... | |
| 00:45, 26 June 2015 |  | 960 × 600 (64 KB) | Delphi234 | legend | |
| 00:36, 26 June 2015 |  | 960 × 600 (64 KB) | Delphi234 | legend | |
| 21:03, 25 June 2015 |  | 959 × 593 (64 KB) | Delphi234 | User created page with UploadWizard |
File usage
Global file usage
The following other wikis use this file:
- Usage on vi.wikipedia.org