
Meteorological history of Hurricane Katrina
 Track of Hurricane Katrina | |
| Meteorological history | |
|---|---|
| Formed | August 23, 2005 |
| Extratropical | August 30, 2005 |
| Dissipated | September 7, 2005[nb 1] |
| Duration | 8 days (tropical cyclone phase only) 30 days (including precursor and extratropical phases) |
| Category 5 major hurricane | |
| 1-minute sustained (SSHWS/NWS) | |
| Highest winds | 175 mph (280 km/h) |
| Lowest pressure | 902 mbar (hPa); 26.64 inHg |
| Overall effects | |
| Areas affected | The Bahamas, United States Gulf Coast (especially Louisiana and Mississippi), Mississippi River Valley, Eastern Canada |
Part of the 2005 Atlantic hurricane season | |
Hurricane Katrina was a devastating tropical cyclone that had a long and complex meteorological history, spanning a month from August 8 to September 7, 2005. Katrina's origins can be traced to the mid-level remnants of Tropical Depression Ten, a tropical wave, and an upper tropospheric trough. The tropical depression emerged as a wave off West Africa on August 8, the second wave followed on August 11, while the trough factored into tropical cyclogenesis between August 17 and 23. The mid-level remnants of Tropical Depression Ten merged with the second tropical wave on August 19 while located north of Hispaniola. Subsequent interaction with the trough spurred convective development, resulting in the formation of Tropical Depression Twelve over the Bahamas on August 23. Deep convection soon blossomed and following the development of banding features the system intensified into a tropical storm. As it strengthened into a hurricane, Katrina made its first landfall in the Miami Metropolitan Area on August 25.
The flat terrain of the Everglades did little to disrupt the core of Katrina, only leading to slight weakening before the cyclone emerged over the Gulf of Mexico. There, exceptionally favorable environmental conditions consisting of high sea surface temperatures, low wind shear, an upper-level anticyclone, and high ocean heat content fueled two periods of rapid intensification. Punctuated by an eyewall replacement cycle on August 27 that dramatically expanded the hurricane's size, Katrina ultimately reached its peak strength as a Category 5 hurricane on the Saffir–Simpson scale on August 28. Its maximum sustained winds reached 175 mph (280 km/h) and its pressure fell to 902 mbar (hPa; 26.63 inHg), ranking it among the strongest ever recorded in the Gulf of Mexico. As the hurricane turned north toward Louisiana, it steadily weakened but continued to expand in size.
Katrina struck southeastern Louisiana on August 29 as a Category 3 hurricane, resulting in one of the greatest catastrophes in modern times in the United States. A record-breaking storm surge and destructive winds decimated coastal communities of Louisiana and Mississippi. The subsequent collapse of levees in New Orleans led to a prolonged humanitarian crisis with floodwaters persisting for nearly two months. Nearly 1,400 people died directly or indirectly from the hurricane and damage totaled $125 billion.[4] As the hurricane moved inland it quickly weakened, degrading below tropical storm strength over the Ohio River Valley on August 30. It was soon absorbed by a cold front in the region the next day. Thereafter, the remnants progressed northeast as an extratropical cyclone. It briefly deepened and stalled over Quebec, Canada, in early September before resuming its journey northeast. The cyclone ultimately dissipated in its entirety on September 7 near Greenland.
Origins[edit]
The origins of Hurricane Katrina are complex and involve the interaction of three weather systems: a tropical wave, the remnants of Tropical Depression Ten, and an upper tropospheric trough.[5] On August 8, 2005, a tropical wave emerged over the Atlantic Ocean from the coast of West Africa.[6] A second wave emerged over the Atlantic on August 11.[5] The former system gradually organized and became Tropical Depression Ten on August 13 while located 1,065 mi (1,715 km) east of Barbados. Strong wind shear produced by an upper tropospheric trough over the western Atlantic caused the depression to quickly degrade into a remnant low as it progressed west-northwest.[5][6] A subsequent convective burst caused its low- and mid-level circulations to detach, with the latter lagging behind. Tropical Depression Ten's remnant vorticity continued west and dissipated near Cuba on August 21.[6] During operational analyses by the National Hurricane Center (NHC), there was uncertainty over the degree of involvement of the remnants of Ten with the eventual formation of Katrina; however, thorough analysis determined them to be two separate systems.[5][6][nb 2] The slower-moving mid-level feature was overtaken by the second tropical wave on August 19.[6] This spurred the formation of widespread, disorganized convection north of Puerto Rico. Moving slowly west-northwest, this feature gradually consolidated as it moved north of Hispaniola to a position east of the Turks and Caicos on August 22.[5]
The upper-tropospheric trough draped across the western Atlantic in the week leading to Katrina's formation provided the final factor leading to the hurricane's genesis. Low-level vorticity associated with this feature led to persistent convection over Cuba and Hispaniola from August 17 to 23, with locally enhanced instability allowing for its persistence.[9] The mid-level remnant of Tropical Depression Ten and the second tropical wave interacted with this trough on August 22, triggering further development of convection. A vorticity maximum then developed over Hispaniola and progressed northeast over the Bahamas.[10] The upper-tropospheric trough subsequently propagated west toward Florida, leading to a relaxation in wind shear over the developing cyclone. This spurred further cyclogenesis and the disturbance finally became Tropical Depression Twelve around 12:00 UTC on August 23 while located about 200 mi (325 km) southeast of Nassau.[5]
Initial development and Florida landfall[edit]

During its nascent stages, Tropical Depression Twelve moved slowly northwest in response to a subtropical ridge over the central Atlantic. This placed the system over high sea surface temperatures averaging more than 1.8 °F (1 °C) above normal.[11] Ocean heat content (OHC) values across the Bahamas averaged 78 kJ cm–2 and increased to 99 kJ cm–2 as the storm approached Florida, providing ample energy for intensification.[12]: 339 [nb 3] Convection deepened throughout August 23 into August 24 with some cloud tops reaching −112 °F (−80 °C).[14] A defined banding feature also began wrapping around the northern side of the depression. Based on aircraft reconnaissance data, the NHC assessed the depression to have intensified into a tropical storm over the central Bahamas by 12:00 UTC on August 23. At this time it was assigned the name Katrina, the eleventh named storm of the annual hurricane season. Katrina turned north-northwest through a weakness in the subtropical ridge as it organized.[15] The center was also pulled north as it gravitated toward convective bursts to the north. Multiple mesovortices were present within these bursts. An upper-level anticyclone became established over the tropical storm during the latter half of August 24, providing Katrina with symmetrical outflow.[16] Banding features subsequently expanded around the cyclone.[17] By August 25, the subtropical ridge moved farther east and ceased being a factor in Katrina's movement. A new ridge along the United States Gulf Coast took its place and caused the tropical cyclone to turn west toward Florida.[18]
Katrina's westward turn on August 25 was accompanied by an intense convective burst with cloud tops colder than −112 °F (−80 °C).[15][19] An increase in wind shear kept the storm's structure asymmetric, pushing dry air into its circulation, with the strongest convection displaced to the south and east,[15][19] but did not become strong enough to significantly disrupt it.[18] The warm waters of the Gulf Stream fueled persistent convection as Katrina approached Florida. An eye-like feature began developing during the latter half of August 25.[20] Katrina intensified into a Category 1 hurricane on the Saffir–Simpson scale (SSHS)[nb 4] around 21:00 UTC.[15] NOAA aircraft reconnaissance recorded surface winds of 74 mph (119 km/h) and Doppler weather radar velocities returned winds of 104 mph (167 km/h) at a height of 3,000 ft (910 m).[22] The upper-level ridge strengthened slightly as Katrina approached South Florida, causing the hurricane to turn west-southwest.[15] This was contrary to the NHC's forecast at the time which had Katrina maintaining a west-northwest to northwest trajectory across the Florida Peninsula and later the Florida Panhandle.[23] Southerly inflow over the warm coastal waters fueled intense convection and enabled further strengthening.[18]
The hurricane soon developed a well-defined eye about 25 mi (40 km) in diameter and made landfall at 22:30 UTC along the Miami-Dade/Broward County line.[15][24] At this time, the storm had maximum sustained winds of 80 mph (130 km/h) and a central pressure of 984 mbar (hPa; 29.06 inHg).[1][15] A weather station in Virginia Key measured sustained winds of 72 mph (116 km/h), and the NHC office—which went through the center of Katrina's eye—had sustained winds of 69 mph (111 km/h) and a gust to 87 mph (140 km/h).[25] A minor storm surge occurred along the southeastern Florida coast.[26] While traversing Monroe County, Katrina briefly weakened to a tropical storm before emerging over the Gulf of Mexico around 05:00 UTC on August 26.[15] The low-lying, swampy terrain of the Everglades had little effect on Katrina's structure and its overall appearance improved as it traversed the Peninsula. The lack of terrain-related shear and higher latent heat releases compared to non-swampy terrain enabled this to take place.[27] Meteorologists described Katrina as "still...an impressive cyclone."[28]
Rapid intensification and peak strength[edit]

Emerging over the Gulf of Mexico around 05:00 UTC on August 26, Katrina quickly regained strength and became a hurricane just one hour later. A strong rainband along the southern side of the storm produced torrential rains and strong winds across the Florida Keys.[15] The Dry Tortugas observed sustained hurricane-force winds, with a peak gust of 105 mph (169 km/h),[25] late in the day as Katrina moved toward the central Gulf. An expansive upper-level anticyclone overspread the Gulf, producing an environment of low wind shear and ample outflow.[31] Sea surface temperatures averaged 86 °F (30 °C) across much of the Gulf, providing the hurricane with ample fuel. Furthermore, localized temperatures exceeding 88 °F (31 °C) were present within two warm-core eddies that broke off the Gulf Loop Current.[29][30] These warm waters led to increasing heat flux in the northeastern quadrant of the hurricane. Kafatos et al. (2006) hypothesized that high sea surface temperatures in the northeast quadrant were vital in Katrina's intensification.[32] Furthermore, Noel Davidson et al. (2008) hypothesized that an upstream Rossby wave influenced this intensification.[33] With these favorable conditions, Katrina underwent two periods of rapid intensification from August 26 to 28, punctuated by an 18-hour pause on August 27.[31] Of the five primary factors for rapid intensification described by Kaplan and DeMaria (2003), conditions were optimal for four of them.[34]
From 06:00 UTC on August 27 to 12:00 UTC the next day, Katrina's maximum sustained winds increased from 75 mph (120 km/h) to 115 mph (185 km/h), marking its intensification to a Category 3 hurricane on the SSHS. A well-defined eye developed during this time.[31] Significant lightning outbursts occurred in Katrina's eyewall throughout the rapid intensification phase.[35] Throughout the remainder of August 27, Katrina's intensity plateaued as an eyewall replacement cycle took place. Its inner eyewall collapsed as a larger one formed around it and subsequently contracted by the morning of August 28.[25] During this cycle, Katrina's overall size expanded dramatically, nearly doubling by the end of the day, with tropical storm-force winds extended up to 160 mi (260 km) from its center.[31] Upwelling of cold-core eddies occurred in the hurricane's wake, with sea surface temperatures falling by 9.0–10.8 °F (5–6 °C) near the Florida Keys.[36]
During the pause in Katrina's intensification on August 27, inner-core convection weakened and the storm's overall structure became more asymmetric.[37] The ridge that previously kept the hurricane on a west-southwest trajectory shifted east, causing Katrina to turn due west and later west-northwest on August 28.[31] This took the hurricane over the Gulf of Mexico's OHC maximum—OHC values reached 123 kJ cm–2 and sea temperatures of 79 °F (26 °C) extended to a depth of 360 ft (110 m)[12]: 340 [30]—providing ample fuel for intensification.[38] Following the consolidation of its new eye, Katrina underwent a second, more intense period of rapid strengthening while still continuing to grow in size. Within a 12-hour period, the storm's winds rose from 115 mph (185 km/h) to 165 mph (265 km/h) as it reached Category 5 hurricane status on the SSHS.[31] Its central pressure fell by 32 mbar (hPa; 0.94 inHg) during the same time.[39] By the latter half of August 28, Katrina's tropical storm-force and hurricane-force winds expanded to 230 mi (370 km) and 105 mi (165 km) from its center, respectively.[31] The eye displayed a pronounced stadium effect at this time, with the eyewall sloping outward with height.[40] As during the first rapid intensification period, lightning was observed in the eyewall. Throughout both lightning outbreaks, a total of 684 strikes were detected by the Los Alamos Sferic Array. Despite occurring over a longer duration, the electrical activity was less than what was detected in Hurricane Rita.[41]
Katrina reached its peak intensity with maximum sustained winds of 175 mph (280 km/h) and a central pressure of 902 mbar (hPa; 26.63 inHg) around 18:00 UTC. Aircraft reconnaissance measured flight-level winds of 191 mph (307 km/h) at the storm's peak. Katrina's estimated intensity was primarily based on this observation, with a 90 percent rule of thumb reduction used to calibrate for surface-level equivalence. Concurrent dropsonde measurements showed instantaneous surface winds up to 165 mph (266 km/h); however, the maximum values were not co-located with the peak flight-level winds. Furthermore, stepped-frequency microwave radiometer data yielded maximum surface winds of 162 mph (261 km/h).[39] Katrina's pressure ranked as the fifth-lowest on record in the Atlantic basin and the second-lowest in the Gulf of Mexico.[2][39][nb 5] At its peak, Katrina's radius of maximum wind of 35 mi (56 km) was among the largest for a hurricane of its intensity.[43]
Gulf Coast landfalls[edit]

Late on August 28, another eyewall replacement cycle began as Katrina turned due north toward Louisiana. However, an increase in wind shear and entrainment of dry air interrupted this cycle. As the inner eyewall collapsed, the outer one failed to consolidate as convection diminished on the western side of the hurricane. Accordingly, the hurricane dramatically weakened during the overnight hours of August 28 into August 29. Furthermore, increased interaction with land—creating additional friction-based shear—could have contributed to this weakening.[44] A study by Edward Rappaport et al. published in Weather and Forecasting in 2010 indicated that large hurricanes, especially intense ones, in the Gulf of Mexico often weaken significantly before landfall.[45] A significant factor in this is the notable reduction of OHC over the northern Gulf compared to the central Gulf. As large hurricanes move into this area, upwelling becomes more pronounced and sea surface temperatures typically drop by 1.8 °F (1 °C) underneath the hurricane.[46] Katrina fell below Category 5 status before 06:00 UTC and continued weakening to a low-end Category 4 hurricane by 09:00 UTC.[1][47] Given the hurricane's approximate 30–35 mi (45–55 km) radius of maximum wind, the NHC indicated sustained Category 4 winds may have briefly occurred along the extreme southeastern coast of Louisiana.[47] With core of Katrina closer to land, clear data was obtainable from NEXRAD installations. Wind velocities reached 162 mph (261 km/h) at 10:15 UTC in the hurricane's northeastern quadrant and steadily decreased over the following hours.[43]
At 11:10 UTC, the storm made landfall near Buras, Louisiana. Based on analysis of aircraft reconnaissance data, the NHC estimated Katrina to have moved ashore with maximum winds of 125 mph (205 km/h) and a central pressure of 920 mbar (hPa; 27.17 inHg). Based on central pressure, Katrina was the third-most intense hurricane to strike the continental United States at the time.[47][nb 6] By landfall, Katrina's eyewall replacement cycle had completed and its core started reorganizing. According to a 2006 presentation by Campo and Rickenbach, Katrina's landfall intensity was of "great debate". NEXRAD base velocities reached 159 mph (256 km/h) as the hurricane moved ashore. Analysis of dropwindsonde data yielded maximum surface winds of 119 mph (192 km/h) while Stepped Frequency Microwave Radiometer data yielded 114 mph (183 km/h).[43]
Katrina weakened further as it crossed the Breton Sound, eventually making its final landfall near along the Louisiana–Mississippi border at 14:45 UTC. By this time, Katrina's maximum winds fell to 120 mph (195 km/h) and its central pressure rose to 928 mbar (hPa; 27.40 inHg).[1] A University of Southern Mississippi buoy over the Mississippi Bight measured ten-minute sustained winds of 76.9 mph (123.8 km/h) and a peak gust of 107.4 mph (172.8 km/h) as the center of Katrina passed 56 mi (90 km) to the west. The buoy was dragged with its anchor 8.1 mi (13 km) southeast during this time. Subsequent analysis of data indicated wave amplitude and buoy tilt could result in a low-bias of NCDC buoy measurements of high-end wind events.[49] Land-based measurements of Katrina's winds are incomplete in the landfall regions; anemometers failed either due to power outages or storm surge hours before the onset of the strongest winds. The highest officially verified gust was 124 mph (200 km/h) in Grand Isle, Louisiana, while an unverified gust to 135 mph (217 km/h) was observed in Poplarville, Mississippi. Located on the western side of Katrina, New Orleans experienced weaker winds. The NHC estimated the city likely experienced sustained Category 1– to Category 2–force winds. A station along the Lake Pontchartrain Causeway measured sustained winds of 78 mph (126 km/h). As winds increase with elevation, the high-rise buildings of the city may have experienced Category 2– to Category 3–force winds.[50]
Landfall forecast[edit]
On August 26, it became clear to forecasters at the NHC that Katrina was tracking significantly more west of the originally expected landfall in the Florida Panhandle. They shifted their forecast path 170 mi (275 km) west during the afternoon to the Mississippi/Alabama border and further to Louisiana and Mississippi that night. NHC director Max Mayfield called "[the one] we’ve been talking about all of these years,"[23] referencing the long-talked of worst-case scenario for New Orleans called "The Big One".[51] Mayfield personally called the governors of Louisiana and Mississippi emphasizing the catastrophic threat the storm posed, something he had only done once before in his 33-year career. By the morning of August 27, forecasters anticipated a direct hit on New Orleans.[23] Following the westward shift, the NHC's forecasts were "exceptionally accurate and consistent". Landfall as a major hurricane was accurately pegged three days ahead of time. Track forecast errors were less than half of the 10-year average for 2005. Four- to five-day errors were slightly larger than the shorter-term overall; however, this was largely related to the west-southwest track shift across the Florida Panhandle rather than Katrina's path in the days leading up to landfall along the Gulf Coast.[52]
-
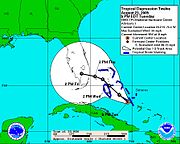 August 23: The NHC forecast the storm to move along a northwest and later west trajectory into the Florida Peninsula
 -
 August 24: forecasts remained largely consistent
 -
 August 25: forecasts remained easterly, with an eventual landfall in the Florida Panhandle
 -
 Afternoon of August 26: forecasts shifted significantly west to the Mississippi/Alabama coast
 -
 Evening of August 26: forecasts shifted farther west, with Katrina posing an imminent threat to Louisiana and Mississippi.[23]


Storm surge[edit]

Hurricane Katrina produced a catastrophic storm surge across coastal Alabama, Louisiana, and Mississippi. The largest surge occurred in the right-front quadrant of the hurricane in Mississippi. Though the total destruction of buildings and infrastructure in coastal communities made post-storm assessments of surge heights difficult, a maximum high water mark of 27.8 ft (8.5 m) was found in Pass Christian.[53] This was the largest storm surge observed in modern history in the United States.[54] Farther east, surge heights reached 17 to 22 ft (5.2 to 6.7 m) in eastern Mississippi and 10 to 15 ft (3.0 to 4.6 m) in Alabama. Seawater penetrated as much as 6 mi (9.7 km) inland on beaches and up to 12 mi (19 km) inland along bays and rivers.[53]The hurricane's massive storm surge is attributed to its intensity the day prior and immense size, with its weakening prior to landfall having little effect. Northward swells propagated ahead of the hurricane and enhanced water levels.[26] The hurricane's perpendicular movement toward the coast across the shallow continental shelf further enhanced the surge.[55] A National Data Buoy Center (NDBC) buoy anchored 74 mi (119 km) south of Dauphin Island, Alabama, measured a peak significant wave height of 55 ft (17 m). This was the largest such measurement from a NDBC buoy on record.[26] Another buoy south of Horn Island measured a peak wave height of 10.73 m (35.2 ft).[56] The Mars oil platform—designed to withstand winds of 140 mph (230 km/h) and waves up to 70 ft (21 m)—sustained extensive damage as the eastern eyewall of Katrina passed over it. In a 2008 study by Wang and Oey, a wave height hindcast simulated maximum wave heights of 79 ft (24 m) in the region of the platform.[57] On the west side of the eye, northerly winds generated significant water rises along the south shores of Lake Pontchartrain. Surge heights reached 14 to 19 ft (4.3 to 5.8 m) in New Orleans, St. Bernard and Plaquemines parishes. New Orleans' levee system was overwhelmed by the rising waters, with overtopping occurring in many locations. This overtopping subsequently undermined the backside of the levees and caused their failure. The ensuing floods ultimately inundated 80 percent of New Orleans, with flood waters persisting until October 11.[53]
Prior to Katrina, little emphasis was placed on the size of a hurricane in relation to the storm surge it would produce. Subsequent studies spurred by Katrina's devastation found significant correlation between storm size and surge. A 2008 study published in the Journal of Physical Oceanography found that surge values could differ as much as 30 percent of storms with similar intensities but different sizes. The paper asserted that the Saffir–Simpson scale was not a good indicator of coastal surge.[58] As a direct result of Katrina and subsequent storms which produced large storm surges, the NHC revised the SSHS in 2010 to remove expected surge values and created a new product to convey forecast surge heights.[59][60][61] A 2014 study published in Earth Interactions showed strong correlation between the radius of a system's storm- and hurricane-force winds 18 hours before landfall and storm surge heights.[62]
Tornado outbreak and dissipation[edit]

Throughout Katrina's progression across the United States, it produced a significant tornado outbreak with 57 tornadoes touching down across 8 states from August 26 to 31. The strongest of these were rated F2 on the Fujita scale: one on August 26 and five on August 29.[65] Most of the tornadoes occurred in the hurricane's right-front quadrant, where strong low-level wind shear, high moisture content, and low convective available potential energy combined to produce locally favorable tornadic conditions.[66] The most prolific activity occurred on August 29 with 39 confirmed tornadoes; 18 of these were in Georgia, a daily record in the state for the month of August.[67] A study published in 2008 documented 23 supercells in the six hours leading up to Katrina's landfall in Louisiana.[66] Localized winds within mesovortices may have reached Category 4 hurricane-equivalent intensity. Contrary to previous studies, the majority of these remained over water.[64]
Once onshore, Katrina rapidly weakened as it traversed Mississippi. Its winds subsided below hurricane-force by 00:00 UTC on August 30 as its center passed northwest of Meridian.[68] Interaction with an upstream trough caused Katrina to turn northeast across the Tennessee Valley and Ohio River Valley on August 30.[3][68] The storm degraded to a tropical depression by 12:00 UTC.[68] Strong westerly shear produced by the trough caused Katrina's upper-level anticyclone to break east away from the low-level circulation on August 30. This led to the separation of the storm's low-level warm core which continued northeast and almost instantaneously transitioned into an extratropical cyclone that day as colder air wrapped in from the northwest.[69] The NHC assessed Katrina's dissipation as a distinct entity by 12:00 UTC on August 31 as it was absorbed into the aforementioned trough over central Ohio.[1] The remnants of Katrina continued across Pennsylvania and New York, eventually crossing the St. Lawrence River into southeastern Canada on September 1.[3] A stationary low over James Bay caused ex-Katrina to turn north and meander over Quebec for several days.[3][69] The storm deepened slightly during this time, with its central pressure falling by 10 mbar (hPa; 0.29 inHg), though its winds did not increase.[69] By September 3, the system acquired a more northeasterly to easterly heading, crossing over Newfoundland and Labrador and then emerging over the Labrador Sea on September 4.[70] The degrading system continued east and ultimately dissipated off the southern tip of Greenland on September 7.[3]
The anticyclone that separated from Katrina on August 30 in conjunction with the frontal boundary that the hurricane merged with had expansive impacts on weather across the Northern Hemisphere over the next two weeks.[71] The interaction of those systems created an upper-level pool of warm air that traveled east-northeast from the Southeastern United States on September 2, to the Azores on September 6, to northern Europe on September 9, and finally to the Tibetan Plateau on September 12 where it dissipated.[72] Northerly flow of tropical moisture and vorticity related to this system influenced the development of Hurricane Nate and the intensification of Hurricane Maria over the Central Atlantic.[73]
-
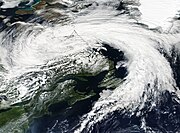
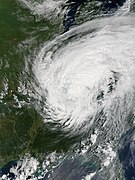 August 30: Increasing shear displaced convection northeast of Katrina's center
 -
 August 31: Katrina's circulation became increasingly elongated as it became extratropical
 -
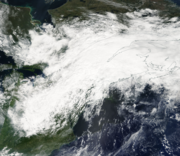
 September 1: Katrina's extratropical remnant deepens over eastern Canada
 -
 September 2: The remnant system began weakening again as it turned east across Labrador


Notes[edit]
- ^ The National Hurricane Center's Tropical Cyclone Report and HURDAT listing from 2005 and 2006, respectively, for Hurricane Katrina list its dissipation date as August 31.[1][2] However, a subsequent paper published in the Monthly Weather Review in 2007 states that Katrina's remnants persisted until September 7.[3]
- ^ The National Hurricane Center has specific rules regarding the reformation of tropical cyclones. When a former tropical cyclone reorganizes sufficiently to be reclassified as a tropical cyclone and is still within its basin of origin, its original number and name are kept upon the re-issuance of advisories. This occurred with Hurricane Ivan in 2004 which maintained a distinct low-level circulation after becoming extratropical and later regenerating into a tropical storm over the Gulf of Mexico.[7][8] If a system crosses out of its basin of origin or is significantly influenced by other systems, it is reclassified as a separate cyclone. This is the case with Tropical Depression Ten and Hurricane Katrina.[6][8][7]
- ^ According to Shay et al. (2000), OHC values of 50 kJ cm–2 or greater support the intensificaton of hurricanes.[13]
- ^ The Saffir–Simpson scale as used in 2005 consisted of sustained winds, central pressures, and expected storm surge values. This scale was modified in 2010 to only encompass winds, now being called the Saffir–Simpson hurricane wind scale.[21]
- ^ Katrina's minimum pressure was only surpassed by Gilbert in 1988 (888 mbar (hPa; 26.22 inHg)), the 1935 Labor Day hurricane (892 mbar (hPa; 26.34 inHg)), Allen in 1980 (899 mbar (hPa; 26.55 inHg)), and Camille in 1969 (900 mbar (hPa; 26.58 inHg)).[2][39] In the Gulf of Mexico specifically, only Camille was stronger.[2] Katrina was soon surpassed the same year by Rita the following month (895 mbar (hPa; 26.43 inHg))[42]—Rita became the strongest storm on record in the Gulf of Mexico—and Wilma in October (882 mbar (hPa; 26.04 inHg)).[39]
- ^ Katrina's pressure was later eclipsed by Hurricane Michael in 2018 which made landfall near Panama City, Florida, with a central pressure of 919 mbar (hPa; 27.14 inHg).[48]
- ^ The map of preliminary reports does not take into account storm surveys and possible duplicate reports. The totals listed on the map differ from the final tally accordingly. The red shaded region on the map indicates locations that likely experienced wind gusts of 113 mph (182 km/h) or higher;[63] the scale of hurricane-related damage in these areas may have led to tornadoes being missed in post-storm surveys.[64]
See also[edit]
References[edit]
- ^ a b c d e Richard et al. 2005, p. 17.
- ^ a b c d "Atlantic hurricane best track (HURDAT version 2)" (Database). United States National Hurricane Center. April 5, 2023. Retrieved April 19, 2024.
 This article incorporates text from this source, which is in the public domain.
- ^ a b c d e McTaggart-Cowan et al. (Part 1) 2007, p. 3906.
- ^ Richard et al. 2005, pp. 11–13.
- ^ a b c d e f Richard et al. 2005, p. 1.
- ^ a b c d e f Beven, Jack L. (January 17, 2006). Tropical Depression Ten (PDF) (Report). Abbreviated Tropical Cyclone Report. National Hurricane Center. Retrieved December 9, 2021.
- ^ a b Stewart, Stacy R. (August 23, 2005). Tropical Depression Twelve Discussion Number 1 (Report). National Hurricane Center. Retrieved November 26, 2021.
- ^ a b National Hurricane Operations Plan (PDF) (Report). United States Department of Commerce. May 2021. pp. 3–5. Retrieved November 26, 2021.
{{cite report}}: Unknown parameter|agency=ignored (help) - ^ McTaggart-Cowan et al. (Part 1) 2007, pp. 3907–3908.
- ^ McTaggart-Cowan et al. (Part 1) 2007, p. 3908.
- ^ McTaggart-Cowan et al. (Part 1) 2007, p. 3912.
- ^ a b Law, Kevin (2011). The Impact of Oceanic Heat Content on the Rapid Intensification of Atlantic Hurricanes (Report). Recent Hurricane Research - Climate, Dynamics, and Societal Impacts. Marshall University. pp. 331–354.
- ^ Lillibridge, John; Shay, Nick; DeMaria, Mark; Goni, Gustavo; Mainelli, Michelle; Scharroo, Remko; Russell, Lamar. Hurricane Intensity Forecasting at NOAA Using Envisat Altimetry (PDF) (Report). National Oceanic and Atmospheric Administration. Retrieved August 22, 2023.
- ^ Knabb, Richard D. (August 24, 2005). Tropical Depression Twelve Discussion Number 2 (Technical Discussion). National Hurricane Center. Retrieved November 25, 2021.
- ^ a b c d e f g h i Richard et al. 2005, p. 2.
- ^ Stewart, Stacy R. (August 24, 2005). Tropical Storm Katrina Discussion Number 4 (Technical Discussion). National Hurricane Center. Retrieved November 25, 2021.
- ^ Stewart, Stacy R. (August 24, 2005). Tropical Storm Katrina Discussion Number 5 (Technical Discussion). National Hurricane Center. Retrieved December 27, 2021.
- ^ a b c McTaggart-Cowan et al. (Part 1) 2007, p. 3913.
- ^ a b Beven, Jack L. (August 25, 2005). Tropical Storm Katrina Discussion Number 7 (Technical Discussion). National Hurricane Center. Retrieved December 27, 2021.
- ^ Stewart, Stacy R. (August 25, 2005). Tropical Storm Katrina Discussion Number 8 (Technical Discussion). National Hurricane Center. Retrieved December 27, 2021.
- ^ National Hurricane Operations Plan (FCM-P12-2010) (PDF) (Report). Office of the Federal Coordinator For Meteorological Services and Supporting Research. May 2010. Archived from the original (PDF) on July 8, 2011. Retrieved October 31, 2023.
- ^ Stewart, Stacy R. (August 25, 2005). Hurricane Katrina Discussion Number 9 (Technical Discussion). National Hurricane Center. Retrieved December 27, 2021.
- ^ a b c d Hurricane Katrina: A National Still Unprepared (PDF) (Report). Government of the United States. 2006. ISBN 0-16-076749-0. Retrieved November 26, 2021.
{{cite report}}: Unknown parameter|agency=ignored (help) - ^ "Katrina". National Weather Service Forecast Office in Miami, Florida. 2005. Retrieved December 20, 2021.
- ^ a b c Richard et al. 2005, p. 5.
- ^ a b c Richard et al. 2005, p. 10.
- ^ McTaggart-Cowan et al. (Part 1) 2007, p. 3916.
- ^ Knabb, Richard D. (August 26, 2005). Hurricane Katrina Discussion Number 11 (Technical Discussion). National Hurricane Center. Retrieved December 27, 2021.
- ^ a b Chen et al. 2018, pp. 293–294.
- ^ a b c Jaimes & Shay 2009, p. 4195.
- ^ a b c d e f g Richard et al. 2005, p. 3.
- ^ Kafatos et al. 2006, p. 5.
- ^ Davidson, Noel E.; Nguyen, Chi Mai; Reeder, Michael J. (April 30, 2008). Downstream development during the rapid intensification of hurricanes Opal and Katrina: the distant trough-interaction problem. 28th Conference on Hurricanes and Tropical Meteorology. American Meteorological Society. Retrieved December 19, 2021.
- ^ Erb, Michael P. (April 6–8, 2008). A Case Study of Hurricane Katrina: Rapid Intensification in the Gulf of Mexico (PDF). Proceedings of The National Conference on Undergraduate Research. University of North Carolina at Asheville. Retrieved December 19, 2021.
- ^ Fierro et al. 2011, p. 1498.
- ^ Chen et al. 2018, p. 297.
- ^ Nguyen et al. 2011, p. 836.
- ^ Rappaport et al. 2010, p. 1387.
- ^ a b c d e Richard et al. 2005, p. 6.
- ^ Dolce, Chris (August 26, 2015). "Inside the Eye of a Hurricane (Photos)". The Weather Channel. Retrieved December 13, 2021.
- ^ Fierro et al. 2011, p. 1499.
- ^ Richard, Knabb D.; Brown, Daniel P.; Rhome, Jamie R. (September 14, 2011). Hurricane Rita (PDF) (Report). Tropical Cyclone Report. National Hurricane Center. p. 5. Retrieved December 9, 2021.
- ^ a b c Campo, Kimberly D.; Rickenbach, Thomas M. (April 26, 2006). Eyewall evolution of Hurricane Katrina near landfall using NEXRAD reflectivity and radial velocity data (PDF). 27th Conference on Hurricanes and Tropical Meteorology. American Meteorological Society. Retrieved August 7, 2023.
- ^ Richard et al. 2005, pp. 3–4.
- ^ Rappaport et al. 2010, p. 1380.
- ^ Rappaport et al. 2010, p. 1389.
- ^ a b c Richard et al. 2005, p. 7.
- ^ Beven, Jack L.; Berg, Robbie; Hagen, Andrew H. (May 17, 2019). Hurricane Michael (AL142018) (PDF) (Report). Tropical Cyclone Report. National Hurricane Center. p. 6. Retrieved December 9, 2021.
- ^ Howden et al. 2008, pp. 613–614.
- ^ Richard et al. 2005, p. 8.
- ^ "New Orleans braces for 'the big one'". CNN. August 29, 2005. Retrieved November 26, 2021.
- ^ Richard et al. 2005, p. 14.
- ^ a b c Richard et al. 2005, p. 9.
- ^ Needham and Keim 2014, p. 2.
- ^ Camelo and Mayo 2021, p. 1.
- ^ Bender III et al. 2010, p. 1018.
- ^ Wang and Oey 2008, pp. 488, 494.
- ^ Irish et al. 2008, p. 2003.
- ^ Walker et al. 2018, p. 1709.
- ^ Camelo and Mayo 2021, p. 2.
- ^ Williams, Jack (September 7, 2012). "Why were hurricane categories established? Behind the Saffir-Simpson scale". The Washington Post. Retrieved December 9, 2021.
- ^ Needham and Keim 2014, p. 12.
- ^ David L. Johnson (June 2006). Service Assessment: Hurricane Katrina August 23–31, 2005 (PDF) (Report). Silver Spring, Maryland: National Oceanic and Atmospheric Administration. Retrieved December 14, 2021.
- ^ a b Lee et al. 2008, p. 1.
- ^ "[United States Tornado Events for August 26–31, 2005]". National Centers for Environmental Information. 2005. Archived from the original on March 4, 2016. Retrieved December 14, 2021.
- ^ a b Lee et al. 2008, p. 2.
- ^ Westbrook, J. Robby; Westbrook, James D. (August 29, 2005). Georgia's Record Tornado Outbreak (PDF) (Report). National Oceanic and Atmospheric Administration. Retrieved December 14, 2021.
{{cite report}}: Unknown parameter|agency=ignored (help) - ^ a b c Richard et al. 2005, p. 4.
- ^ a b c McTaggart-Cowan et al. (Part 1) 2007, p. 3922.
- ^ McTaggart-Cowan et al. (Part 1) 2007, p. 3923.
- ^ McTaggart-Cowan et al. (Part 2) 2007, p. 3927.
- ^ McTaggart-Cowan et al. (Part 2) 2007, p. 3934.
- ^ McTaggart-Cowan et al. (Part 2) 2007, pp. 3935–3940.
Sources[edit]
- Bender III, L. C.; Guinasso Jr., N. L.; Walpert, J. N.; Howden, S. D. (June 2010). "A Comparison of Methods for Determining Significant Wave Heights—Applied to a 3-m Discus Buoy during Hurricane Katrina". Journal of Atmospheric and Oceanic Technology. 27 (6): 1012–1018. Bibcode:2010JAtOT..27.1012B. doi:10.1175/2010JTECHO724.1.
- Camelo, Jeane; Mayo, Talea (September 2021). "The lasting impacts of the Saffir-Simpson Hurricane Wind Scale on storm surge risk communication: The need for multidisciplinary research in addressing a multidisciplinary challenge". Weather and Climate Extremes. 33: 100335. Bibcode:2021WCE....3300335C. doi:10.1016/j.wace.2021.100335.
- Chen, Yingjian; Zhang, Fuqing; Green, Benjamin W.; Yu, Xiping (January 2018). "Impacts of Ocean Cooling and Reduced Wind Drag on Hurricane Katrina (2005) Based on Numerical Simulations". Monthly Weather Review. 146 (1): 286–307. Bibcode:2018MWRv..146..287C. doi:10.1175/MWR-D-17-0170.1. S2CID 125276574.
- Fierro, Alexandre O.; Shao, Xuan-Min; Hamlin, Timothy; Reisner, Jon M.; Harlin, Jeremiah (May 2011). "Evolution of Eyewall Convective Events as Indicated by Intracloud and Cloud-to-Ground Lightning Activity during the Rapid Intensification of Hurricanes Rita and Katrina". Monthly Weather Review. 139 (5): 1492–1504. Bibcode:2011MWRv..139.1492F. doi:10.1175/2010MWR3532.1. S2CID 122040578.
- Howden, Stephan; Gilhousen, David; Guinasso, Norman; Walpert, John; Sturgeon, Michael; Bender, Les (April 2008). "Hurricane Katrina Winds Measured by a Buoy-Mounted Sonic Anemometer". Journal of Atmospheric and Oceanic Technology. 25 (4): 607–616. Bibcode:2008JAtOT..25..607H. doi:10.1175/2007JTECHO518.1.
- Irish, Jennifer L.; Resio, Donald T.; Ratcliff, Jay J. (September 2008). "The Influence of Storm Size on Hurricane Surge". Journal of Physical Oceanography. 38 (9): 2003–2013. Bibcode:2008JPO....38.2003I. doi:10.1175/2008JPO3727.1. S2CID 55061204.
- Jaimes, Benjamin; Shay, Lynn K. (December 2009). "Mixed Layer Cooling in Mesoscale Oceanic Eddies during Hurricanes Katrina and Rita". Weather and Forecasting. 137 (12): 4188–4207. Bibcode:2009MWRv..137.4188J. doi:10.1175/2009MWR2849.1.
- Kafatos, Menas; Sun, Donglian; Gautam, Ritesh; Boybeyi, Zafer; Yang, Ruixin; Cervone, Guido (September 2006). "Role of anomalous warm gulf waters in the intensification of Hurricane Katrina". Geophysical Research Letters. 33 (17): 1–5. Bibcode:2006GeoRL..3317802K. doi:10.1029/2006GL026623. S2CID 54490765.
- Lee, Wen-Chau; Bell, Michael M.; Goodman Jr., Keith E. (August 19, 2008). "Supercells and mesocyclones in outer rainbands of Hurricane Katrina (2005)". Geophysical Research Letters. 35 (16): 1–5. Bibcode:2008GeoRL..3516803L. doi:10.1029/2008GL034724. S2CID 38553646.
- McTaggart-Cowan, Ron; Bosart, Lance F.; Gyakum, John R.; Atallah, Eyad H. (December 2007). "Hurricane Katrina (2005). Part I: Complex Life Cycle of an Intense Tropical Cyclone". Monthly Weather Review. 135 (12): 3905–3926. Bibcode:2007MWRv..135.3905M. doi:10.1175/2007MWR1875.1.
- McTaggart-Cowan, Ron; Bosart, Lance F.; Gyakum, John R.; Atallah, Eyad H. (December 2007). "Hurricane Katrina (2005). Part II: Evolution and Hemispheric Impacts of a Diabatically Generated Warm Pool". Monthly Weather Review. 135 (12): 3927–3949. Bibcode:2007MWRv..135.3927M. doi:10.1175/2007MWR2096.1. S2CID 121064343.
- Needham, Hal F.; Keim, Barry D. (March 2014). "An Empirical Analysis on the Relationship between Tropical Cyclone Size and Storm Surge Heights along the U.S. Gulf Coast". Earth Interactions. 18 (8): 1–15. Bibcode:2014EaInt..18h...1N. doi:10.1175/2013EI000558.1. S2CID 140650715.
- Nguyen, Mai Chi; Reeder, Michael J.; Davidson, Noel E.; Smith, Roger K.; Montgomery, Michael T. (May 2011). "Inner-core vacillation cycles during the intensification of Hurricane Katrina". Quarterly Journal of the Royal Meteorological Society. 137 (657): 829–844. Bibcode:2011QJRMS.137..829N. doi:10.1002/qj.823. S2CID 55110430. (subscription required)
- Rappaport, Edward; Franklin, James L.; Schumacher, Andrea B.; DeMaria, Mark; Shay, Lynn K.; Gibney, Ethan J. (October 2010). "Tropical Cyclone Intensity Change before U.S. Gulf Coast Landfall". Weather and Forecasting. 25 (5): 1380–1396. Bibcode:2010WtFor..25.1380R. doi:10.1175/2010WAF2222369.1.
- Richard, Knabb D.; Rhome, Jamie R.; Brown, Daniel P. (December 20, 2005). Hurricane Katrina (PDF) (Report). Tropical Cyclone Report. National Hurricane Center.
- Walker, Amanda M.; Titley, David W.; Mann, Michael E.; Najjar, Raymond G.; Miller, Sonya K. (December 2018). "A Fiscally Based Scale for Tropical Cyclone Storm Surge". Weather and Forecasting. 33 (6): 1709–1723. Bibcode:2018WtFor..33.1709W. doi:10.1175/WAF-D-17-0174.1. S2CID 85512943.
- Wang, Dong-Ping; Oey, Lie-Yauw (April 2008). "Hindcast of Waves and Currents in Hurricane Katrina". Bulletin of the American Meteorological Society. 89 (4): 487–496. Bibcode:2008BAMS...89..487W. doi:10.1175/BAMS-89-4-487.
Further reading[edit]
- Didlake Jr., Anthony C.; Houze Jr., Robert A. (October 2009). "Convective-Scale Downdrafts in the Principal Rainband of Hurricane Katrina (2005)". Monthly Weather Review. 137 (10): 3269–3293. Bibcode:2009MWRv..137.3269D. doi:10.1175/2009MWR2827.1. S2CID 17055308.
- Green, Benjamin W.; Zhang, Fuqing; Markowsk, Paul (December 2011). "Multiscale Processes Leading to Supercells in the Landfalling Outer Rainbands of Hurricane Katrina (2005)". Weather and Forecasting. 26 (6): 828–847. Bibcode:2011WtFor..26..828G. doi:10.1175/WAF-D-10-05049.1.
- Rogers, Robert; Aberson, Sim; Black, Michael; Black, Peter; Cione, Joe; Dodge, Peter; Dunion, Jason; Gamache, John; Kaplan, John; Powell, Mark; Shay, Nick; Surgi, Naomi; Uhlhorn, Eric (November 2006). "The Intensity Forecasting Experiment: A NOAA Multiyear Field Program for Improving Tropical Cyclone Intensity Forecasts". Bulletin of the American Meteorological Society. 87 (11): 1523–1538. Bibcode:2006BAMS...87.1523R. doi:10.1175/BAMS-87-11-1523.