
2022 Southwark London Borough Council election
| ||||||||||||||||||||||||||||
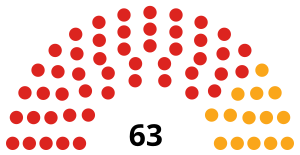
All 63 council seats | ||||||||||||||||||||||||||||
|---|---|---|---|---|---|---|---|---|---|---|---|---|---|---|---|---|---|---|---|---|---|---|---|---|---|---|---|---|
| ||||||||||||||||||||||||||||
| ||||||||||||||||||||||||||||
The 2022 Southwark London Borough Council election took place on 5 May 2022. All 63 members of Southwark London Borough Council were elected. The elections took place alongside local elections in the other London boroughs and elections to local authorities across the United Kingdom.
In the previous election in 2018, the Labour Party maintained its control of the council, winning 49 out of the 63 seats with the Liberal Democrats forming the council opposition with the remaining 14 seats.
Labour kept control in 2022, taking 3 seats from the Liberal Democrats in London Bridge and West Bermondsey and increasing their majority to 52.
Background[edit]
History[edit]
The thirty-two London boroughs were established in 1965 by the London Government Act 1963. They are the principal authorities in Greater London and have responsibilities including education, housing, planning, highways, social services, libraries, recreation, waste, environmental health and revenue collection. Some powers are shared with the Greater London Authority, which also manages passenger transport, police, and fire.[1]

Since its formation, Southwark has been continuously under Labour control, apart from a period of no overall control from 2002 to 2010. Apart from an independent in 1982 and a Green Party councillor in 2006, all councillors have been from the Labour Party, Liberal Democrats or the Conservative Party. Labour regained its majority in the 2010 election, winning 35 seats with the Liberal Democrats on 25 and the Conservatives on three. Labour extended its majority by winning 48 seats in the 2014 election with the Liberal Democrats on 13 seats and the Conservatives on two. The Conservatives lost all their representation in the most recent election in 2018, with Labour winning 49 seats with 53.09% of the vote across the borough and the Liberal Democrats winning the remaining 14 seats with 21.36% of the vote. The Green Party received 12.04% of the vote and the Conservatives received 10.46% of the vote but neither party won any seats.[2] The incumbent council leader, Peter John, was reappointed following the election.[3]
Council term[edit]
The Labour councillor Kieron Williams was elected as the leader of the council in September 2020, succeeding Peter John.[4]
Electoral process[edit]
Southwark, like other London borough councils, elects all of its councillors at once every four years. The previous election took place in 2018. The election took place by multi-member first-past-the-post voting, with each ward being represented by two or three councillors. Electors had as many votes as there are councillors to be elected in their ward, with the top two or three being elected.
All registered electors (British, Irish, Commonwealth and European Union citizens) living in London aged 18 or over were entitled to vote in the election. People who lived at two addresses in different councils, such as university students with different term-time and holiday addresses, were entitled to be registered for and vote in elections in both local authorities.[5] Voting in-person at polling stations took place from 7:00 to 22:00 on election day, and voters were able to apply for postal votes or proxy votes in advance of the election.[5]
Previous council composition[edit]
-
 Council composition after the 2018 election
 -
 Council composition before the 2022 election
 -
 Council composition after the 2022 election


| After 2018 election | Before 2022 election | After 2022 election | ||||||
|---|---|---|---|---|---|---|---|---|
| Party | Seats | Party | Seats | Party | Seats | |||
| Labour | 49 | Labour | 48 | Labour | 52 | |||
| Liberal Democrats | 14 | Liberal Democrats | 14 | Liberal Democrats | 11 | |||
| Vacant | 1 | |||||||
Results summary[edit]
| Party | Seats | Gains | Losses | Net gain/loss | Seats % | Votes % | Votes | +/− | |
|---|---|---|---|---|---|---|---|---|---|
| Labour | 52 | 3 | 0 | 82.5 | 52.64 | 39,835 | |||
| Liberal Democrats | 11 | 0 | 3 | 17.5 | 19.53 | 14,778 | |||
| Green | 0 | 0 | 0 | 0.0 | 16.47 | 12,464 | |||
| Conservative | 0 | 0 | 0 | 0.0 | 9.74 | 7,368 | |||
| Women's Equality | 0 | 0 | 0 | 0.0 | 0.55 | 414 | |||
| TUSC | 0 | 0 | 0 | 0.0 | 0.41 | 313 | |||
| Let London Live | 0 | 0 | 0 | 0.0 | 0.26 | 200 | New | ||
| Reform UK | 0 | 0 | 0 | 0.0 | 0.23 | 171 | New | ||
| Independent | 0 | 0 | 0 | 0.0 | 0.1 | 78 | |||
| SDP | 0 | 0 | 0 | 0.0 | 0.08 | 57 | New | ||


Ward Results[edit]

Borough & Bankside[edit]
| Party | Candidate | Votes | % | ±% | |
|---|---|---|---|---|---|
| Liberal Democrats | Victor Chamberlain* | 1,236 | 56.1 | ||
| Liberal Democrats | Irina Von Wiese | 1,187 | 53.9 | ||
| Liberal Democrats | David Watson | 1,136 | 51.6 | ||
| Labour | Ronald Harley | 725 | 32.9 | ||
| Labour | Maren White | 699 | 31.7 | ||
| Labour | Theophilus Toweh | 698 | 31.7 | ||
| Conservative | Daniel Callaghan | 223 | 10.1 | ||
| Conservative | Jason Richards | 212 | 9.6 | ||
| Conservative | Vignesh Murthy | 195 | 8.9 | ||
| TUSC | Charlie Kennedy | 85 | 3.9 | New | |
| Turnout | 2,202 | 34.50 | -1.52 | ||
| Liberal Democrats hold | Swing | ||||
| Liberal Democrats hold | Swing | ||||
| Liberal Democrats hold | Swing | ||||
Camberwell Green[edit]

| Party | Candidate | Votes | % | ±% | |
|---|---|---|---|---|---|
| Labour | Suzanne Abachor | 2,282 | 69.2 | ||
| Labour | Dora Dixon-Fyle* | 2,281 | 69.1 | ||
| Labour | Kieron Williams* | 2,090 | 63.3 | ||
| Green | Valerie Remy | 798 | 24.2 | ||
| Liberal Democrats | Douglas Board | 353 | 10.7 | ||
| Liberal Democrats | Christopher Hudson | 350 | 10.7 | ||
| Conservative | David Bradbury | 273 | 8.3 | ||
| Conservative | Robert Hayward | 254 | 7.7 | ||
| Conservative | Clara Vacondio | 219 | 6.6 | ||
| Liberal Democrats | Jason Leech | 200 | 6.1 | ||
| TUSC | Thea Everett | 126 | 3.8 | New | |
| Turnout | 3,300 | 30.21 | -0.53 | ||
| Labour hold | Swing | ||||
| Labour hold | Swing | ||||
| Labour hold | Swing | ||||
Champion Hill[edit]

| Party | Candidate | Votes | % | ±% | |
|---|---|---|---|---|---|
| Labour | Sarah King* | 1,629 | 65.7 | ||
| Labour | Esme Hicks | 1,610 | 64.9 | ||
| Green | Michael Millar | 535 | 21.6 | ||
| Liberal Democrats | Columba Blango | 311 | 12.5 | ||
| Liberal Democrats | Jonathan Hunt | 293 | 11.8 | ||
| Conservative | Graham Davison | 202 | 8.1 | ||
| Conservative | Francis Truss | 187 | 7.5 | ||
| Turnout | 2,481 | 36.69 | +3.90 | ||
| Labour hold | Swing | ||||
| Labour hold | Swing | ||||
Chaucer[edit]

| Party | Candidate | Votes | % | ±% | |
|---|---|---|---|---|---|
| Labour | Helen Dennis* | 1,916 | 66.9 | ||
| Labour | Laura Johnson | 1,761 | 61.5 | ||
| Labour | Joseph Vambe | 1,470 | 51.3 | ||
| Green | Robert Hutchinson | 637 | 22.2 | ||
| Liberal Democrats | Poddy Clark | 609 | 21.3 | ||
| Liberal Democrats | Monsur Ahmed | 539 | 18.8 | ||
| Liberal Democrats | Mackie Sheik | 403 | 14.1 | ||
| Conservative | Andrew Dowsett | 280 | 9.8 | ||
| Conservative | Richard Packer | 257 | 9.0 | ||
| Conservative | Tom Packer | 251 | 8.8 | ||
| Turnout | 2,865 | 28.69 | -0.04 | ||
| Labour hold | Swing | ||||
| Labour hold | Swing | ||||
| Labour hold | Swing | ||||
Dulwich Hill[edit]

| Party | Candidate | Votes | % | ±% | |
|---|---|---|---|---|---|
| Labour | Maggie Browning* | 1,846 | 68.0 | ||
| Labour | Jon Hartley* | 1,298 | 47.8 | ||
| Green | Myrtle Bruce-Mitford | 698 | 25.7 | ||
| Liberal Democrats | Tara Copeland | 489 | 18.0 | ||
| Liberal Democrats | Thomas Rogers | 341 | 12.6 | ||
| Conservative | Rupert Watson | 289 | 10.7 | ||
| Conservative | Edith Okparaocha | 277 | 10.2 | ||
| Turnout | 2,713 | 38.97 | +0.06 | ||
| Labour hold | Swing | ||||
| Labour hold | Swing | ||||
Dulwich Village[edit]

| Party | Candidate | Votes | % | ±% | |
|---|---|---|---|---|---|
| Labour | Margy Newens* | 2,111 | 45.4 | ||
| Labour | Richard Leeming* | 1,922 | 41.4 | ||
| Liberal Democrats | Richard Wingfield | 1,133 | 24.4 | ||
| Conservative | Tristan Honeyborne | 1,063 | 22.9 | ||
| Conservative | Clive Rates | 1,053 | 22.7 | ||
| Liberal Democrats | Raghav Parkash | 1,037 | 22.3 | ||
| Green | Christopher Langdon | 387 | 8.3 | ||
| Green | Piers Holden | 370 | 8.0 | ||
| Reform UK | Paul Randolfi | 50 | 1.1 | New | |
| Turnout | 4,645 | 60.66 | +3.44 | ||
| Labour hold | Swing | ||||
| Labour hold | Swing | ||||
Dulwich Wood[edit]

| Party | Candidate | Votes | % | ±% | |
|---|---|---|---|---|---|
| Labour | Catherine Rose* | 1,783 | 58.1 | ||
| Labour | Andy Simmons* | 1,621 | 52.8 | ||
| Conservative | Lindsay Chathli | 706 | 23.0 | ||
| Conservative | Peter Heaton-Jones | 675 | 22.0 | ||
| Green | Guy Fairbairn | 449 | 14.6 | ||
| Green | Vincent Matley | 303 | 9.9 | ||
| Liberal Democrats | Iain Johncock | 300 | 9.8 | ||
| Liberal Democrats | Aiken Furlong | 299 | 9.7 | ||
| Turnout | 3,120 | 42.40 | +1.85 | ||
| Labour hold | Swing | ||||
| Labour hold | Swing | ||||
Faraday[edit]

| Party | Candidate | Votes | % | ±% | |
|---|---|---|---|---|---|
| Labour | Samuel Foster | 1,475 | 63.4 | ||
| Labour | Kezia Harper | 1,450 | 62.4 | ||
| Labour | Kimberly McIntosh | 1,445 | 62.2 | ||
| Green | Emma He | 390 | 16.8 | ||
| Green | Liba Hoskin | 369 | 15.9 | ||
| Conservative | Novelette Ellis | 250 | 10.8 | ||
| Conservative | Andrew Neville | 226 | 9.7 | ||
| Liberal Democrats | David Noakes** | 216 | 9.3 | ||
| Let London Live | Piers Corbyn | 200 | 8.6 | New | |
| Liberal Democrats | Cheikh Jalloh | 197 | 8.5 | ||
| Liberal Democrats | Lorraine Zuleta | 189 | 8.1 | ||
| Conservative | Tarsilo Onuluk | 174 | 7.5 | ||
| Turnout | 2,325 | 29.87 | +0.16 | ||
| Labour hold | Swing | ||||
| Labour hold | Swing | ||||
| Labour hold | Swing | ||||
David Noakes was a sitting councillor for Borough & Bankside.
Goose Green[edit]

| Party | Candidate | Votes | % | ±% | |
|---|---|---|---|---|---|
| Labour | Portia Mwangangye | 2,495 | 59.6 | ||
| Labour | James McAsh* | 2,323 | 55.5 | ||
| Labour | Charlie Smith* | 2,108 | 50.4 | ||
| Liberal Democrats | Clare Donachie | 955 | 22.8 | ||
| Green | Philip Collins | 932 | 22.3 | ||
| Liberal Democrats | Michael Green | 736 | 17.6 | ||
| Liberal Democrats | Sophie Roach | 684 | 16.3 | ||
| Green | David Jennings | 636 | 15.2 | ||
| Women's Equality | Claire Webb | 414 | 9.9 | ||
| Conservative | Michael Poole-Wilson | 311 | 7.4 | ||
| Conservative | Qin Hong | 294 | 7.0 | ||
| Conservative | Adam van den Broek | 275 | 6.6 | ||
| Turnout | 4,186 | 39.86 | -4.37 | ||
| Labour hold | Swing | ||||
| Labour hold | Swing | ||||
| Labour hold | Swing | ||||
London Bridge & West Bermondsey[edit]

| Party | Candidate | Votes | % | ±% | |
|---|---|---|---|---|---|
| Labour | Emily Hickson | 1,716 | 48.3 | ||
| Labour | Sunil Chopra** | 1,586 | 44.7 | ||
| Labour | Sam Dalton | 1,562 | 44.0 | ||
| Liberal Democrats | William Houngbo* | 1,205 | 33.9 | ||
| Liberal Democrats | Martina Moh | 1,193 | 33.6 | ||
| Liberal Democrats | Damian O'Brien* | 1,119 | 31.5 | ||
| Green | Susan Hunter | 495 | 13.9 | ||
| Green | Dauphine Hymans | 343 | 9.7 | ||
| Green | Christopher Terrill | 280 | 7.9 | New | |
| Conservative | Ralph Tiffin | 262 | 7.4 | ||
| Conservative | Oliver Ward | 261 | 7.3 | ||
| Conservative | Mohammed Okrekson | 237 | 6.7 | ||
| Turnout | 3,552 | 33.53 | +4.96 | ||
| Labour gain from Liberal Democrats | Swing | ||||
| Labour gain from Liberal Democrats | Swing | ||||
| Labour gain from Liberal Democrats | Swing | ||||
Sunil Chopra was a sitting councillor for Nunhead & Queen's Road.
Newington[edit]

| Party | Candidate | Votes | % | ±% | |
|---|---|---|---|---|---|
| Labour | Alice Macdonald* | 2,051 | 63.4 | +2.0 | |
| Labour | Natasha Ennin | 2,011 | 62.1 | -3.6 | |
| Labour | John Batteson | 1,955 | 60.4 | -3.6 | |
| Green | Suzy Gillett | 494 | 15.3 | +2.1 | |
| Green | Clare Wood | 453 | 14.0 | +3.1 | |
| Liberal Democrats | James Gurling | 408 | 12.6 | -1.4 | |
| Green | Lina Usma | 371 | 11.5 | +1.1 | |
| Liberal Democrats | Abdul Gbla | 368 | 11.4 | -1.5 | |
| Liberal Democrats | Joshua Sharman | 350 | 10.8 | -1.7 | |
| Conservative | Charles Dempsey | 311 | 9.6 | +1.1 | |
| Conservative | Suzie Bridgen-Didier-Garnham | 297 | 9.2 | +1.3 | |
| Conservative | Erda Prenci | 233 | 7.2 | -0.3 | |
| Turnout | 3,236 | 31.62 | +0.03 | ||
| Labour hold | Swing | ||||
| Labour hold | Swing | ||||
| Labour hold | Swing | ||||
North Bermondsey[edit]

| Party | Candidate | Votes | % | ±% | |
|---|---|---|---|---|---|
| Liberal Democrats | Rachel Bentley | 1,909 | 51.5 | +2.2 | |
| Liberal Democrats | Hamish McCallum* | 1,732 | 46.8 | +3.0 | |
| Liberal Democrats | Emily Tester | 1,724 | 46.5 | +2.1 | |
| Labour | Kaied Ghiyatha | 1,227 | 33.1 | +0.4 | |
| Labour | Claudia Reid | 1,194 | 32.2 | +0.8 | |
| Labour | Sirajul Islam** | 1,036 | 28.0 | -1.7 | |
| Green | Nicola Hearn | 641 | 17.3 | +7.9 | |
| Conservative | Ian Leonard | 415 | 11.2 | -1.6 | |
| Conservative | Ravi Gidwani | 370 | 10.0 | -1.1 | |
| Conservative | Kono Kono-Ugen | 301 | 8.1 | -2.3 | |
| Turnout | 3,705 | 32.85 | +2.12 | ||
| Liberal Democrats hold | Swing | ||||
| Liberal Democrats hold | Swing | ||||
| Liberal Democrats hold | Swing | ||||
Sirajul Islam was a sitting councillor for Chaucer.
North Walworth[edit]

| Party | Candidate | Votes | % | ±% | |
|---|---|---|---|---|---|
| Labour | Naima Ali | 1,906 | 60.5 | -1.7 | |
| Labour | Darren Merrill* | 1,771 | 56.2 | +1.7 | |
| Labour | Martin Seaton* | 1,672 | 53.1 | -2.8 | |
| Green | Peter Baffoe | 652 | 20.7 | +5.4 | |
| Liberal Democrats | Thomas James | 453 | 14.4 | -0.9 | |
| Green | Steven Lehmann | 424 | 13.5 | +2.6 | |
| Green | Thomas Wedell | 413 | 13.1 | +2.8 | |
| Liberal Democrats | Ryan Kingsbury | 396 | 12.6 | -1.8 | |
| Liberal Democrats | Faisal Maramazi | 337 | 10.7 | -1.9 | |
| Conservative | Craig Cox | 324 | 10.3 | -0.1 | |
| Conservative | Christine Wallace | 295 | 9.4 | -0.7 | |
| Conservative | Diako Tanou | 237 | 7.5 | -1.6 | |
| Independent | Lucy Carrington | 78 | 2.5 | -2.0 | |
| Turnout | 3,149 | 29.56 | -0.10 | ||
| Labour hold | Swing | ||||
| Labour hold | Swing | ||||
| Labour hold | Swing | ||||
Nunhead & Queen's Road[edit]

| Party | Candidate | Votes | % | ±% | |
|---|---|---|---|---|---|
| Labour | Gavin Edwards* | 2,072 | 52.5 | -15.9 | |
| Labour | Reginald Popoola | 2,040 | 51.7 | -17.6 | |
| Labour | Sandra Rhule* | 2,025 | 51.3 | -15.4 | |
| Green | Claire Sheppard | 1,551 | 39.3 | +23.4 | |
| Green | Catherine Dawkins | 1,516 | 38.3 | +23.9 | |
| Green | Richard Taylor | 1,270 | 32.2 | +18.8 | |
| Conservative | Harry Chathli | 216 | 5.5 | -2.0 | |
| Liberal Democrats | Fergus Anderson | 193 | 4.9 | -1.6 | |
| Conservative | Domonic Garriques | 191 | 4.8 | -2.7 | |
| Conservative | Ian Twinn | 188 | 4.7 | -2.8 | |
| Liberal Democrats | Claire Mayne-Constantinou | 142 | 3.6 | -2.3 | |
| Liberal Democrats | Christopher Taras | 134 | 3.4 | -2.5 | |
| Turnout | 3,949 | 34.10 | +4.65 | ||
| Labour hold | Swing | ||||
| Labour hold | Swing | ||||
| Labour hold | Swing | ||||
Old Kent Road[edit]

| Party | Candidate | Votes | % | ±% | |
|---|---|---|---|---|---|
| Labour | Evelyn Akoto* | 2,283 | 70.5 | +0.4 | |
| Labour | Richard Livingstone* | 2,046 | 63.1 | -4.7 | |
| Labour | Michael Situ* | 1,959 | 60.5 | -3.8 | |
| Green | Sandra Lane | 599 | 18.5 | +6.7 | |
| Conservative | Roman Alexander | 400 | 12.3 | +2.9 | |
| Liberal Democrats | Keira Kyriacou | 375 | 11.6 | -3.9 | |
| Conservative | Derek Fordham | 351 | 10.8 | +1.9 | |
| Liberal Democrats | Moulka Beddar | 350 | 10.8 | -1.6 | |
| Liberal Democrats | Paul Kyriacou | 314 | 9.7 | -3.5 | |
| Conservative | Abel Png | 278 | 8.6 | +0.3 | |
| Reform UK | John Cronin | 121 | 3.7 | N/A | |
| Turnout | 3,240 | 27.23 | -0.73 | ||
| Labour hold | Swing | ||||
| Labour hold | Swing | ||||
| Labour hold | Swing | ||||
Peckham[edit]

| Party | Candidate | Votes | % | ±% | |
|---|---|---|---|---|---|
| Labour | Leona Sabina Emmanuel | 2,148 | 79.5 | +4.7 | |
| Labour | Barrie Hargrove* | 2,080 | 77.0 | -0.3 | |
| Labour | Cleo Soanes* | 1,987 | 73.6 | -0.1 | |
| Liberal Democrats | Philomena Ofodu | 290 | 10.7 | +5.3 | |
| Conservative | Dudley Cowan | 269 | 10.0 | +2.8 | |
| Conservative | Alfred Daramola | 259 | 9.6 | +3.3 | |
| Liberal Democrats | Oliver Stanton | 232 | 8.6 | +2.6 | |
| Liberal Democrats | James Okosun | 208 | 7.7 | +2.4 | |
| Conservative | Martina Ward | 198 | 7.3 | +0.8 | |
| Turnout | 2,701 | 25.80 | -2.22 | ||
| Labour hold | Swing | ||||
| Labour hold | Swing | ||||
| Labour hold | Swing | ||||
Peckham Rye[edit]

| Party | Candidate | Votes | % | ±% | |
|---|---|---|---|---|---|
| Labour | Renata Hamvas* | 1,802 | 62.6 | -0.1 | |
| Labour | Victoria Mills* | 1,751 | 60.9 | -2.5 | |
| Green | Gerard Bennett | 650 | 22.6 | +2.1 | |
| Green | Steven Sheppard | 581 | 20.2 | N/A | |
| Conservative | Nathan Gamester | 247 | 8.6 | +1.3 | |
| Conservative | Oliver Wooller | 213 | 7.4 | -0.9 | |
| Liberal Democrats | Eduardo Reyes | 185 | 6.4 | -0.1 | |
| Liberal Democrats | Christian Blango | 181 | 6.3 | -0.1 | |
| Turnout | 2,877 | 39.41 | -0.33 | ||
| Labour hold | Swing | ||||
| Labour hold | Swing | ||||
Rotherhithe[edit]

| Party | Candidate | Votes | % | ±% | |
|---|---|---|---|---|---|
| Labour | Stephanie Cryan* | 1,782 | 53.0 | +2.8 | |
| Labour | Bethan Roberts | 1,653 | 49.2 | +5.5 | |
| Labour | Kathleen Whittam* | 1,558 | 46.3 | +1.0 | |
| Liberal Democrats | Paul Bowers | 788 | 23.4 | -9.8 | |
| Liberal Democrats | Jit Lim | 695 | 20.7 | -8.7 | |
| Liberal Democrats | Mark Platt | 600 | 17.8 | -11.1 | |
| Green | Colin Boyle | 498 | 14.8 | +3.4 | |
| Green | Susan Cooke | 485 | 14.4 | N/A | |
| Green | Roger Manser | 421 | 12.5 | +0.8 | |
| Conservative | Laura Collins | 381 | 11.3 | +0.2 | |
| Conservative | Michael Tobin | 322 | 9.6 | -0.4 | |
| Conservative | Robert Ferguson | 318 | 9.5 | -0.2 | |
| TUSC | Robert Law | 102 | 3.0 | N/A | |
| SDP | Andy Kekwick | 57 | 1.7 | N/A | |
| Turnout | 3,363 | 31.22 | -0.77 | ||
| Labour hold | Swing | ||||
| Labour hold | Swing | ||||
| Labour hold | Swing | ||||
Rye Lane[edit]

| Party | Candidate | Votes | % | ±% | |
|---|---|---|---|---|---|
| Labour | Jasmine Ali* | 2,343 | 68.0 | -3.5 | |
| Labour | Esme Dobson | 2,123 | 61.6 | -2.7 | |
| Labour | Chloe Tomlinson | 2,008 | 58.3 | +0.4 | |
| Green | Peter Reder | 943 | 27.4 | +10.8 | |
| Green | Alexander van Vliet | 653 | 18.9 | +2.6 | |
| Liberal Democrats | Amy Glover | 451 | 13.1 | +2.6 | |
| Conservative | Peter Felix | 268 | 7.8 | -0.5 | |
| Conservative | Alys Denby | 259 | 7.5 | -0.5 | |
| Conservative | Barry Joseph | 243 | 7.1 | -0.6 | |
| Liberal Democrats | Andras Juhasz | 243 | 7.1 | -2.0 | |
| Liberal Democrats | James Kean | 238 | 6.9 | -0.5 | |
| TUSC | Beth Powell | 114 | 3.3 | N/A | |
| Turnout | 3,446 | 31.93 | -1.19 | ||
| Labour hold | Swing | ||||
| Labour hold | Swing | ||||
| Labour hold | Swing | ||||
South Bermondsey[edit]

| Party | Candidate | Votes | % | ±% | |
|---|---|---|---|---|---|
| Labour | Cassandra Brown | 2,025 | 54.0 | +6.6 | |
| Labour | Sunny Lambe* | 1,900 | 50.7 | +2.4 | |
| Labour | Leo Pollak* | 1,759 | 46.9 | +0.9 | |
| Liberal Democrats | Alice Thomas | 1,407 | 37.5 | +1.7 | |
| Liberal Democrats | Michael Tipler | 1,295 | 34.6 | +0.5 | |
| Liberal Democrats | Patrickson Obanya | 1,277 | 34.1 | +3.5 | |
| Conservative | Lewis Jones | 367 | 9.8 | +2.7 | |
| Conservative | Jordan Abdi | 359 | 9.6 | +3.2 | |
| Conservative | Luke Warren | 328 | 8.8 | +2.5 | |
| Turnout | 3,748 | 33.58 | +1.13 | ||
| Labour hold | Swing | ||||
| Labour hold | Swing | ||||
| Labour hold | Swing | ||||
St George's[edit]

| Party | Candidate | Votes | % | ±% | |
|---|---|---|---|---|---|
| Liberal Democrats | Maria Linforth-Hall * | 1,034 | 48.8 | +2.9 | |
| Liberal Democrats | Graham Neale * | 929 | 43.8 | +0.2 | |
| Labour | Alex Marullo | 836 | 39.4 | -0.8 | |
| Labour | Samantha Vacciana | 821 | 38.7 | -1.2 | |
| Green | Mary Clegg | 227 | 10.7 | +1.9 | |
| Conservative | Alex Deane | 140 | 6.6 | -1.0 | |
| Conservative | Sasha Zaroubin | 114 | 5.4 | -1.7 | |
| Turnout | 2,121 | 38.07 | +0.29 | ||
| Liberal Democrats hold | Swing | ||||
| Liberal Democrats hold | Swing | ||||
St Giles[edit]

| Party | Candidate | Votes | % | ±% | |
|---|---|---|---|---|---|
| Labour | Eleanor Cumbo | 2,606 | 68.2 | +6.1 | |
| Labour | Jason Ochere* | 2,360 | 61.8 | +9.3 | |
| Labour | (Robert) Ian Wingfield* | 2,217 | 58.1 | +5.1 | |
| Green | Eleanor Margolies | 1,186 | 31.1 | -4.1 | |
| Green | Bryan Symons | 712 | 18.6 | -5.4 | |
| Liberal Democrats | Rebecca Kadritzke | 408 | 10.7 | +0.5 | |
| Liberal Democrats | Christopher Annous | 316 | 8.3 | +1.2 | |
| Conservative | Sarah Leivers | 306 | 8.0 | +1.5 | |
| Liberal Democrats | Thomas Chesterman | 300 | 7.9 | +2.0 | |
| Conservative | Edward Heckels | 270 | 7.1 | +0.9 | |
| Conservative | Christopher Mottau | 230 | 6.0 | +0.2 | |
| Turnout | 3,819 | 33.75 | -0.73 | ||
| Labour hold | Swing | ||||
| Labour hold | Swing | ||||
| Labour hold | Swing | ||||
Surrey Docks[edit]

| Party | Candidate | Votes | % | ±% | |
|---|---|---|---|---|---|
| Liberal Democrats | Jane Salmon* | 1,475 | 46.1 | -0.1 | |
| Liberal Democrats | Nicholas Johnson* | 1,329 | 41.5 | -2.5 | |
| Liberal Democrats | Adam Hood | 1,298 | 40.5 | -9.7 | |
| Labour | Jen Thornton | 1,095 | 34.2 | +3.2 | |
| Labour | Amandeep Kellay | 1,056 | 33.0 | +6.7 | |
| Labour | Callum Parrish | 920 | 28.7 | +2.5 | |
| Green | Jason Conway | 825 | 25.8 | +10.9 | |
| Conservative | Hannah Ginnett | 399 | 12.5 | -2.5 | |
| Conservative | Andrew Cusack | 371 | 11.6 | -2.1 | |
| Conservative | Mark Findell | 346 | 10.8 | -5.1 | |
| Turnout | 3,202 | 32.07 | +0.60 | ||
| Liberal Democrats hold | Swing | ||||
| Liberal Democrats hold | Swing | ||||
| Liberal Democrats hold | Swing | ||||
2022-2026 by-elections[edit]
Newington[edit]

| Party | Candidate | Votes | % | ±% | |
|---|---|---|---|---|---|
| Labour | Youcef Hassaine | 1,524 | 57.6 | ||
| Liberal Democrats | Vikas Aggarwal | 738 | 27.9 | ||
| Green | David Buendia | 237 | 9.0 | ||
| Conservative | Lewis Jones | 149 | 5.6 | ||
| Turnout | 2,648 | ||||
| Registered electors | |||||
| Labour hold | Swing | ||||
References[edit]
- ^ "The essential guide to London local government | London Councils". www.londoncouncils.gov.uk. Retrieved 10 October 2021.
- ^ "Local election 2018: Labour holds on to council - Conservatives wiped off electoral map". Southwark News. Retrieved 21 October 2021.
- ^ "Peter John: A true champion for Southwark". Southwark News. Retrieved 21 October 2021.
- ^ "Kieron Williams elected new Southwark Labour leader". Southwark News. Retrieved 21 October 2021.
- ^ a b "How the elections work | London Councils". www.londoncouncils.gov.uk. Retrieved 14 September 2021.
- ^ "Southwark Council Elections 5 May 2022 - Information for Voters".
- ^ "Barking And Dagenham Borough Council Elections". Barking And Dagenham Borough Council. Barking And Dagenham Borough Council. Retrieved 31 March 2023.