
Amber Valley Borough Council elections
Amber Valley Borough Council elections are held every four years to elect councillors to Amber Valley Borough Council, the local authority for the non-metropolitan district of Amber Valley in Derbyshire, England. Since the last boundary changes in 2023, 42 councillors have been elected to represent 18 wards. Prior to 2023 a third of the council was elected three years out of every four.[1]
Council election results[edit]
The party make up of the council after each election is as shown below.
| Election | Labour | Conservative | Green Party | Liberal Democrats | Independent | BNP | Total | Notes |
|---|---|---|---|---|---|---|---|---|
| 1973 | 33 | 6 | 0 | 3 | 18 | 0 | 60 | Inaugural election |
| 1976 | 18 | 4 | 0 | 14 | 24 | 0 | 60 | |
| 1979 | 18 | 12 | 0 | 7 | 6 | 0 | 43 | New Boundaries |
| 1980 | 24 | 11 | 0 | 4 | 4 | 0 | 43 | |
| 1982 | 22 | 10 | 0 | 7 | 4 | 0 | 43 | |
| 1983 | 23 | 7 | 0 | 8 | 5 | 0 | 43 | |
| 1995 | 37 | 6 | 0 | 0 | 0 | 0 | 43 | |
| 1996 | 37 | 6 | 0 | 0 | 0 | 0 | 43 | |
| 1998 | 37 | 6 | 0 | 0 | 0 | 0 | 43 | |
| 1999 | 32 | 11 | 0 | 0 | 0 | 0 | 43 | |
| 2000 | 12 | 32 | 0 | 0 | 1 | 0 | 45 | New Boundaries |
| 2002 | 19 | 26 | 0 | 0 | 0 | 0 | 45 | |
| 2003 | 25 | 20 | 0 | 0 | 0 | 0 | 45 | |
| 2004 | 24 | 21 | 0 | 0 | 0 | 0 | 45 | |
| 2006 | 18 | 27 | 0 | 0 | 0 | 0 | 45 | |
| 2007 | 17 | 28 | 0 | 0 | 0 | 0 | 45 | |
| 2008 | 14 | 29 | 0 | 0 | 0 | 0 | 45 | |
| 2010 | 14 | 29 | 0 | 0 | 0 | 2 | 45 | |
| 2011 | 15 | 28 | 0 | 0 | 0 | 2 | 45 | |
| 2012 | 21 | 24 | 0 | 0 | 0 | 2 | 45 | |
| 2014 | 23 | 22 | 0 | 0 | 0 | 0 | 45 | |
| 2015 | 21 | 24 | 0 | 0 | 0 | 0 | 45 | |
| 2016 | 22 | 23 | 0 | 0 | 0 | 0 | 45 | |
| 2018 | 20 | 25 | 0 | 0 | 0 | 0 | 45 | |
| 2019 | 25 | 19 | 1 | 0 | 0 | 0 | 45 | |
| 2021 | 16 | 28 | 1 | 0 | 0 | 0 | 45 | |
| 2022 | 11 | 30 | 3 | 0 | 1 | 0 | 45 | |
| 2023 | 26 | 7 | 6 | 1 | 2 | 0 | 42 | New Boundaries |
Council elections[edit]
- 1973 Amber Valley District Council election
- 1976 Amber Valley District Council election
- 1979 Amber Valley District Council election (New ward boundaries)[2]
- 1980 Amber Valley District Council election
- 1982 Amber Valley District Council election
- 1983 Amber Valley District Council election
- 1984 Amber Valley District Council election
- 1986 Amber Valley District Council election (District boundary changes took place but the number of seats remained the same)[3]
- 1987 Amber Valley District Council election
- 1988 Amber Valley District Council election
- 1990 Amber Valley Borough Council election
- 1991 Amber Valley Borough Council election
- 1992 Amber Valley Borough Council election
- 1994 Amber Valley Borough Council election (Borough boundary changes took place but the number of seats remained the same)[4]
- 1995 Amber Valley Borough Council election
- 1996 Amber Valley Borough Council election
- 1998 Amber Valley Borough Council election
- 1999 Amber Valley Borough Council election
- 2000 Amber Valley Borough Council election (New ward boundaries increased the number of seats by two)[5]
- 2002 Amber Valley Borough Council election
- 2003 Amber Valley Borough Council election
- 2004 Amber Valley Borough Council election
- 2006 Amber Valley Borough Council election
- 2007 Amber Valley Borough Council election
- 2008 Amber Valley Borough Council election
- 2010 Amber Valley Borough Council election
- 2011 Amber Valley Borough Council election
- 2012 Amber Valley Borough Council election
- 2014 Amber Valley Borough Council election
- 2015 Amber Valley Borough Council election
- 2016 Amber Valley Borough Council election
- 2018 Amber Valley Borough Council election
- 2019 Amber Valley Borough Council election
- 2021 Amber Valley Borough Council election
- 2022 Amber Valley Borough Council election
- 2023 Amber Valley Borough Council election (New ward boundaries, number of councillors reduced by 3)[6]
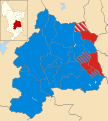
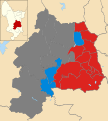
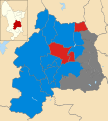
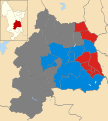
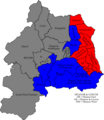
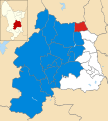
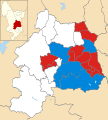
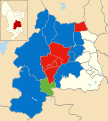
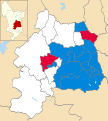
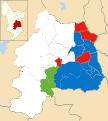
Borough result maps[edit]
-
 2000 results map
 -
 2002 results map
 -
 2003 results map
 -
 2004 results map
 -
 2006 results map
 -
 2007 results map
 -
 2008 results map
 -
 2011 results map
 -
 2012 results map
 -
 2014 results map
 -
 2015 results map
 -
 2016 results map
 -
 2018 results map
 -
 2019 results map
 -
 2021 results map
 -
 2022 results map
 -
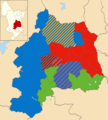 2023 results map


By-election results[edit]
1994-2000[edit]
| Party | Candidate | Votes | % | ±% | |
|---|---|---|---|---|---|
| Conservative | 619 | 48.2 | |||
| Labour | 545 | 42.5 | |||
| Liberal Democrats | 119 | 9.3 | |||
| Majority | 74 | 5.7 | |||
| Turnout | 1,164 | 24.0 | |||
| Conservative gain from Labour | Swing | ||||
1997-2001[edit]
| Party | Candidate | Votes | % | ±% | |
|---|---|---|---|---|---|
| Labour | 354 | 76.5 | -8.3 | ||
| Liberal Democrats | 109 | 23.5 | +8.3 | ||
| Majority | 245 | 53.0 | |||
| Turnout | 463 | 11.8 | |||
| Labour hold | Swing | ||||
| Party | Candidate | Votes | % | ±% | |
|---|---|---|---|---|---|
| Conservative | 372 | 44.7 | +4.2 | ||
| Labour | 259 | 31.1 | -23.1 | ||
| Independent | 165 | 19.8 | +19.8 | ||
| Liberal Democrats | 36 | 4.3 | -2.8 | ||
| Majority | 113 | 13.6 | |||
| Turnout | 832 | 45.0 | |||
| Conservative gain from Labour | Swing | ||||
| Party | Candidate | Votes | % | ±% | |
|---|---|---|---|---|---|
| Conservative | 673 | 68.8 | +23.3 | ||
| Labour | 305 | 31.2 | -23.3 | ||
| Majority | 368 | 37.6 | |||
| Turnout | 978 | 22.9 | |||
| Conservative gain from Labour | Swing | ||||
2000-2006[edit]
| Party | Candidate | Votes | % | ±% | |
|---|---|---|---|---|---|
| Conservative | 618 | 53.8 | -3.9 | ||
| Labour | 531 | 46.2 | +10.2 | ||
| Majority | 87 | 7.6 | |||
| Turnout | 1,149 | 28.0 | |||
| Conservative hold | Swing | ||||
| Party | Candidate | Votes | % | ±% | |
|---|---|---|---|---|---|
| Conservative | 557 | 52.3 | +3.6 | ||
| Labour | 381 | 35.8 | +5.7 | ||
| Liberal Democrats | Tony Cooper | 127 | 11.9 | -9.3 | |
| Majority | 176 | 16.5 | |||
| Turnout | 1,065 | 24.0 | |||
| Conservative hold | Swing | ||||
| Party | Candidate | Votes | % | ±% | |
|---|---|---|---|---|---|
| Labour | Alan Longdon | 570 | 42.0 | -11.9 | |
| BNP | Paul Snell | 411 | 30.2 | +30.2 | |
| Conservative | Jean Parry | 317 | 23.3 | -22.8 | |
| Liberal Democrats | Sally McIntosh | 61 | 4.5 | +4.5 | |
| Majority | 159 | 11.8 | |||
| Turnout | 1,359 | 33.0 | |||
| Labour hold | Swing | ||||
2006-2010[edit]
| Party | Candidate | Votes | % | ±% | |
|---|---|---|---|---|---|
| Labour | Lyndsay D Cox | 585 | 52.4 | +23.7 | |
| Conservative | Matthew C Joyes | 531 | 47.6 | -1.7 | |
| Majority | 54 | 4.9 | |||
| Turnout | 1,116 | 24.1 | |||
| Labour hold | Swing | 12.6% | |||
2010-2014[edit]
| Party | Candidate | Votes | % | ±% | |
|---|---|---|---|---|---|
| Labour | Isobel Harry (E) | 557 | 52.3 | -5.8 | |
| UKIP | Garry Smith | 250 | 23.5 | +9.6 | |
| Conservative | Ron Ashton | 219 | 20.6 | -3.3 | |
| Liberal Democrats | Keith Falconbridge | 39 | 3.7 | +3.7 | |
| Majority | 307 | 28.8 | |||
| Turnout | 26.8 | ||||
| Labour hold | Swing | ||||
| Party | Candidate | Votes | % | ±% | |
|---|---|---|---|---|---|
| Labour | Sheila Oaks (E) | 548 | 58.4 | +8.4 | |
| Conservative | Steven Grainger | 350 | 37.3 | +11.0 | |
| Liberal Democrats | Kate Smith | 41 | 4.4 | -0.2 | |
| Majority | 198 | 21.1 | |||
| Turnout | 18.6 | ||||
| Labour hold | Swing | ||||
| Party | Candidate | Votes | % | ±% | |
|---|---|---|---|---|---|
| Labour | Celia Cox (E) | 595 | 52.9 | -3.3 | |
| UKIP | Philip Rose | 259 | 23.0 | +23.0 | |
| Conservative | Mark Burrell | 229 | 20.4 | -5.2 | |
| Liberal Democrats | Kate Smith | 41 | 3.6 | +3.6 | |
| Majority | 336 | 29.9 | |||
| Turnout | 23.3 | ||||
| Labour hold | Swing | ||||
2018-2022[edit]
| Party | Candidate | Votes | % | ±% | |
|---|---|---|---|---|---|
| Conservative | Dawn Harper | 242 | 54.9 | -13.9 | |
| Liberal Democrats | Kate Smith | 114 | 25.9 | +21.4 | |
| Labour | Dean Watson | 53 | 12.0 | -7.2 | |
| Green | Sally Lowick | 32 | 7.3 | -0.2 | |
| Majority | 128 | 29.0 | |||
| Turnout | 441 | 22.9 | |||
| Conservative hold | Swing | ||||
2023-2027[edit]
| Party | Candidate | Votes | % | ±% | |
|---|---|---|---|---|---|
| Conservative | Tony Harper | ||||
| Liberal Democrats | Marcus Johnson | ||||
| Labour | Amy Trewick | ||||
| Green | Fiona Horton | ||||
| Majority | |||||
| Turnout | |||||
| Swing | |||||
References[edit]
- ^ "The Amber Valley (Electoral Changes) Order 2022", legislation.gov.uk, The National Archives, SI 2022/810, retrieved 21 August 2022
- ^ The District of Amber Valley (Electoral Arrangements) Order 1978
- ^ The Derbyshire and Nottinghamshire (Areas) Order 1985
- ^ legislation.gov.uk - The Derbyshire and Nottinghamshire (County Boundaries) Order 1992. Retrieved on 5 November 2015.
- ^ "Amber Valley". BBC Online. Retrieved 7 August 2008.
- ^ "UK Government Web Archive". webarchive.nationalarchives.gov.uk. Retrieved 10 May 2023.
- ^ "Swing to Labour reverses Tory lead". guardian.co.uk. London. 21 June 2002. Retrieved 25 March 2010.
- ^ "Tories make first gain of Cameron era". guardian.co.uk. London. 9 December 2005. Retrieved 5 September 2009.
- ^ "New gloss hides old race claims". Nottingham Evening Post. 3 February 2006.
- ^ "Ripley and Marehay by-election results announced". thisis derbyshire.co.uk. 18 September 2009. Retrieved 21 September 2009.
- By-election results Archived 29 March 2010 at the Wayback Machine