
Demographics of Manchester
| Demographics of Manchester | |
|---|---|
 Population pyramid of Manchester | |
| Population | |
| Growth rate | |
| Life expectancy | |
| • male | |
| • female | |
| Nationality | |
| Major ethnic |
|
| Minor ethnic |
|
Manchester is a populous city in the North West of England. Its total population as of 2021 is 551,938.
This article focuses on the district, that being the City of Manchester rather than the built-up urban area.
Population[edit]
Historically the population of Manchester began to increase rapidly during the Victorian era, estimated at 354,930 for Manchester and 110,833 for Salford in 1865,[4] and peaking at 766,311 in 1931. From then the population began to decrease rapidly, due to slum clearance and the increased building of social housing overspill estates by Manchester City Council after the Second World War such as Hattersley and Langley.
The population of Manchester currently sits at 551,938 as of 2021.
Age[edit]
- Population pyramid of Manchester over time
-
 1861
1861 -
 1881
1881 -
 1891
1891 -
 1911
1911 -
 1931
1931 -
 1951
1951 -
 1961
1961 -
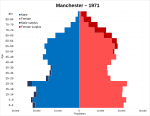 1971
1971 -
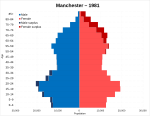 1981
1981 -
 1991
1991 -
 2001
2001 -
 2011
2011 -
 2021
2021


Country of birth[edit]

| Country of birth | Year | |||||||||
|---|---|---|---|---|---|---|---|---|---|---|
| 1981[5] | 1991[6] | 2001[7] | 2011[8] | 2021[9] | ||||||
| Number | % | Number | % | Number | % | Number | % | Number | % | |
| 388,622 | 88.8% | 358,399 | 88.5% | 334,771 | 85.3% | 376,066 | 74.7% | 378,730 | 68.6% | |
| Foreign born | 49,040 | 11.2% | 46,462 | 11.5% | 58,048 | 14.7% | 127,061 | 25.3% | 173,208 | 31.4% |
| Total | 437,662 | 100% | 404,861 | 100% | 392,819 | 100% | 503,127 | 100% | 551,938 | 100% |
Ethnicity[edit]


Manchester is an ethnically diverse city, comprising a vast degree of ethnicites from all over the world. The ethnic makeup of the city during the 21st century has changed, with 81% defining themselves as White and 74.5% White British in 2001, and 56.8% defining themselves as white and 48.7% White British in 2021. Asian British people have risen from around 6.6% of the city in 1991, to a total of 20.9% in 2021, with the majority being of Pakistani ethnicity. Black British people have additionally risen, in conjunction with Mixed ethnicity people and Other ethnic groups category, rising from 4.7% in 1991 to 12%, 3.2% in 2001 to 5.2% and 1.4% in 1991 to 5.1% respectively.
Below shows the estimations of the ethnicity of Manchester for 1971 and 1981, and the census results for Manchester's ethnicity in 1991 to 2021.
| Ethnic group | Year | |||||||||||||
|---|---|---|---|---|---|---|---|---|---|---|---|---|---|---|
| 1966 estimations[10] | 1971 estimations[11] | 1981 estimations[12] | 1991[13] | 2001[14] | 2011[15] | 2021[16] | ||||||||
| Number | % | Number | % | Number | % | Number | % | Number | % | Number | % | Number | % | |
| White: Total | – | – | 512,936 | 95.8% | 396,487 | 92.1% | 353,685 | 87.4% | 318,013 | 81% | 335,109 | 66.6% | 313,632 | 56.8% |
| White: British | – | – | – | – | – | – | – | – | 292,498 | 74.5% | 298,237 | 59.3% | 268,572 | 48.7% |
| White: Irish | – | – | – | – | – | – | – | – | 14,826 | 3.8% | 11,843 | 2.4% | 9,442 | 1.7% |
| White: Traveller of Irish heritage | – | – | – | – | – | – | – | – | – | – | 509 | 0.1% | 597 | 0.1% |
| White: Gypsy/Roma | – | – | – | – | – | – | – | – | – | – | – | – | 883 | 0.2% |
| White: Other | – | – | – | – | – | – | – | – | 10,689 | 2.7% | 24,520 | 4.9% | 34,138 | 6.2% |
| Asian / Asian British: Total | – | – | – | – | – | – | 26,766 | 6.6% | 41,003 | 10.4% | 85,986 | 17.1% | 115,109 | 20.9% |
| Asian / Asian British: Indian | – | – | – | – | – | – | 4,404 | 5,817 | 11,417 | 2.3% | 14,857 | 2.7% | ||
| Asian / Asian British: Pakistani | – | – | – | – | – | – | 15,360 | 3.8% | 23,104 | 5.9% | 42,904 | 8.5% | 65,875 | 11.9% |
| Asian / Asian British: Bangladeshi | – | – | – | – | – | – | 2,000 | 3,654 | 6,437 | 1.3% | 9,673 | 1.8% | ||
| Asian / Asian British: Chinese | – | – | – | – | – | – | 3,103 | 5,126 | 13,539 | 2.7% | 12,644 | 2.3% | ||
| Asian / Asian British: Other Asians | – | – | – | – | – | – | 1,899 | 3,302 | 11,689 | 2.3% | 12,060 | 2.2% | ||
| Black / Black British: Total | – | – | – | – | – | – | 18,898 | 4.7% | 17,739 | 4.5% | 43,484 | 8.6% | 65,893 | 12% |
| Black: African | – | – | – | – | – | – | 3,465 | 0.9% | 6,655 | 1.7% | 25,718 | 5.1% | 47,858 | 8.7% |
| Black: Caribbean | – | – | – | – | – | – | 10,390 | 2.6% | 9,044 | 2.3% | 9,642 | 1.9% | 10,472 | 1.9% |
| Black: Other Blacks | – | – | – | – | – | – | 5,043 | 2,040 | 8,124 | 1.6% | 7,563 | 1.4% | ||
| Mixed / British Mixed | – | – | – | – | – | – | – | – | 12,673 | 3.2% | 23,161 | 4.6% | 29,026 | 5.2% |
| White and Black Caribbean | – | – | – | – | – | – | – | – | 5,295 | 8,877 | 1.8% | 9,987 | 1.8% | |
| White and Black African | – | – | – | – | – | – | – | – | 2,412 | 4,397 | 0.9% | 5,992 | 1.1% | |
| White and Asian | – | – | – | – | – | – | – | – | 2,459 | 4,791 | 1% | 6,149 | 1.1% | |
| Any other mixed background | – | – | – | – | – | – | – | – | 2,507 | 5,096 | 1% | 6,898 | 1.2% | |
| Other: Total | – | – | – | – | – | – | 5,517 | 1.4% | 3,391 | 0.9% | 15,387 | 3.1% | 28,278 | 5.1% |
| Other: Arab | – | – | – | – | – | – | 5,517 | 1.4% | 3,391 | 0.9% | 9,503 | 1.9% | 15,028 | 2.7% |
| Other: Any other ethnic group | – | – | – | – | – | – | – | – | – | – | 5,884 | 1.2% | 13,250 | 2.4% |
| Ethnic minority | 14,000 | – | 22,484 | 4.2% | 33,944 | 7.9% | 51,181 | 12.6% | 74,806 | 19% | 168,018 | 33.4% | 238,306 | 43.2% |
| Total: | – | 100% | 535,420 | 100% | 430,431 | 100% | 404,866 | 100% | 392,819 | 100% | 503,127 | 100% | 551,938 | 100% |
Religion[edit]
Religious beliefs, according to the 2021 census[17]
Religion in Manchester is complex. In recent decades, the city has seen a large degree of expansion of its Islamic population, now as of 2021 constituting 22.3% of the population, while Christians have declined in pre-dominance to 36.2% in 2021, from 62.4% in 2001.
| Religion | 2001[18] | 2011[19] | 2021[20] | |||
|---|---|---|---|---|---|---|
| Number | % | Number | % | Number | % | |
| Christian | 245,203 | 62.4 | 245,247 | 48.7 | 199,873 | 36.2 |
| Buddhist | 2,144 | 0.5 | 3,879 | 0.8 | 3,219 | 0.6 |
| Hindu | 2,849 | 0.7 | 5,452 | 1.1 | 6,048 | 1.1 |
| Jewish | 3,076 | 0.8 | 2,613 | 0.5 | 2,632 | 0.5 |
| Muslim | 35,806 | 9.1 | 79,496 | 15.8 | 122,962 | 22.3 |
| Sikh | 1,708 | 0.4 | 2,292 | 0.5 | 2,718 | 0.5 |
| Other religion | 1,111 | 0.3 | 1,889 | 0.4 | 2,736 | 0.5 |
| No religion | 62,744 | 16.0 | 127,485 | 25.3 | 179,037 | 32.4 |
| Religion not stated | 38,178 | 9.7 | 34,774 | 6.9 | 32,713 | 5.9 |
| Total | 392,819 | 100% | 503,127 | 100% | 551,938 | 100% |
Languages[edit]
A variety of languages are spoken in Manchester. 18.3% do not speak English as their main language, although just 2% or fewer residents are unable to speak English at all.[21]
| Main language (aged 3+) | 2011[22] | 2021[23] | ||
|---|---|---|---|---|
| Number | % | Number | % | |
| English | 400,886 | 83.4% | 434,289 | 81.7% |
| Non-English | 79,852 | 16.6% | 97,194 | 18.3% |
| Total | 480,738 | 100% | 531,483 | 100% |
Industry[edit]

| Industry sector | Manchester (aged 16 and over in employment) | |
|---|---|---|
| 2021[24] | ||
| Number | % | |
| A: Agriculture, Forestry and fishing | 205 | 0.1% |
| B: Mining and quarrying | 86 | – |
| C: Manufacturing | 10,303 | 4.4% |
| D: Electricity, gas, steam and air conditioning supply | 969 | 0.4% |
| E: Water supply; Sewerage, Waste management and Remediation activities | 861 | 0.4% |
| F: Construction | 11,817 | 5.0% |
| G: Wholesale and retail trade; repair of motor vehicles and motorcycles | 36,174 | 15.4% |
| H: Transport and storage | 14,042 | 6.0% |
| J: Information and communication | 16,420 | 7.0% |
| I: Accommodation and food service activities (Distribution or catering; 1981 + 1991) | 12,331 | 5.3% |
| K: Financial and insurance activities | 7,419 | 3.2% |
| L: Real estate activities | 3,535 | 1.5% |
| M: Professional, scientific and technical activities | 17,909 | 7.6% |
| N: Administrative and support service activities | 15,445 | 6.6% |
| P: Education | 9,945 | 4.2% |
| Q: Human health and social work activities | 25,443 | 10.9% |
| O: Public administration and defence; compulsory social security | 40,867 | 17.4% |
| R, S, T, U: Other and not stated | 10,519 | 4.5% |
| Total | 234,290 | 100.0 |
Method of transportation to work
| Method of transportation | Manchester (aged 16 and over in employment) | |
|---|---|---|
| 2021[25] | ||
| Number | % | |
| Work mainly at or from home | 73,964 | 31.6% |
| Underground, metro, light rail, tram | 6,152 | 2.6% |
| Train | 2,848 | 1.2% |
| Bus, minibus or coach | 23,669 | 10.1% |
| Taxi | 3,654 | 1.6% |
| Motorcycle, scooter or moped | 462 | 0.2% |
| Driving a car or van | 82,379 | 35.2% |
| Passenger in a car or van | 8,217 | 3.5% |
| Bicycle | 7,305 | 3.1% |
| On foot | 22,647 | 9.7% |
| Other method of travel to work (or Not stated) | 2,986 | 1.3% |
| Total | 234,283 | 100% |
National identity[edit]
| National identity | 2021[26] | |
|---|---|---|
| Number | % | |
| British only | 310,709 | 56.3 |
| English only | 48,800 | 8.8 |
| Welsh only | 2,310 | 0.4 |
| Scottish only | – | – |
| Northern irish only | – | – |
| Any combination of UK only identities | 6,985 | 1.3 |
| English and British only | 56,401 | 10.2 |
| Welsh and British only | 891 | 0.2 |
| Scottish and British only | – | – |
| Northern Irish and British only | – | – |
| Irish only | 6,175 | 1.1 |
| Irish and at least one UK identity | 990 | 0.2 |
| Other identity only | 103,748 | 18.8 |
| Other identity and at least one UK identity | 14,929 | 2.7 |
| Total | 551,938 | 100.0 |
Education[edit]
| Level of qualification | Manchester (aged 16 and over, not in education) | |
|---|---|---|
| 2021[27] | ||
| Number | % | |
| No qualifications | 86,110 | 19.7% |
| Level 1 and entry level qualifications | 34,988 | 8.0% |
| Level 2 qualifications | 45,164 | 10.3% |
| Apprenticeship | 15,322 | 3.5% |
| Level 3 qualifications | 79,621 | 18.2% |
| Level 4 qualifications or above | 164,763 | 37.6% |
| Other qualifications | 11,990 | 2.7% |
| Total | 437,958 | 100.0 |
See also[edit]
- Demographics of the United Kingdom
- Demographics of England
- Demographics of London
- Demographics of Birmingham
- Demographics of Greater Manchester
- List of English cities by population
- List of English districts by population
- List of English districts and their ethnic composition
- List of English districts by area
- List of English districts by population density
References[edit]
- ^ "Population and household estimates, England and Wales - Office for National Statistics". www.ons.gov.uk. Retrieved 2022-12-13.
- ^ "Life expectancy for local areas of the UK - Office for National Statistics". www.ons.gov.uk. Retrieved 2022-12-13.
- ^ "Life expectancy for local areas of the UK - Office for National Statistics". www.ons.gov.uk. Retrieved 2022-12-13.
- ^ "New Zealand Herald, 1866-10-04". paperspast.natlib.govt.nz. Archived from the original on 11 November 2018. Retrieved 11 November 2018.
- ^ "1981 census - small area statistics - Nomis - Official Census and Labour Market Statistics". www.nomisweb.co.uk. Retrieved 2023-06-22.
- ^ "1991 census - local base statistics - Nomis - Official Census and Labour Market Statistics". www.nomisweb.co.uk. Retrieved 2023-06-22.
- ^ "KS005 - Country of birth - Nomis - Official Census and Labour Market Statistics". www.nomisweb.co.uk. Retrieved 2023-06-22.
- ^ "KS204EW (Country of birth) - Nomis - Official Census and Labour Market Statistics". www.nomisweb.co.uk. Retrieved 2023-06-22.
- ^ "TS004 - Country of birth - Nomis - Official Census and Labour Market Statistics". www.nomisweb.co.uk. Retrieved 2023-04-22.
- ^ Brown, Laurence; Cunningham, Niall (April 2016). "The Inner Geographies of a Migrant Gateway: Mapping the Built Environment and the Dynamics of Caribbean Mobility in Manchester, 1951–2011". Social Science History. 40 (1): 93–120. doi:10.1017/ssh.2015.82. ISSN 0145-5532.
- ^ Jones, P. N. (1978). "The Distribution and Diffusion of the Coloured Population in England and Wales, 1961-71". Transactions of the Institute of British Geographers. 3 (4): 515–532. Bibcode:1978TrIBG...3..515J. doi:10.2307/622127. ISSN 0020-2754. JSTOR 622127. PMID 12157820.
- ^ Equality, Commission for Racial (1985). "Ethnic minorities in Britain: statistical information on the pattern of settlement". Commission for Racial Equality: Table 2.2.
- ^ Data is taken from United Kingdom Casweb Data services of the United Kingdom 1991 Census on Ethnic Data for England, Scotland and Wales (Table 6)
- ^ "Office of National Statistics; 2001 Census Key Statistics". webarchive.nationalarchives.gov.uk. Retrieved 2021-09-07.
- ^ "2011 Census: Ethnic group, local authorities in England and Wales". ONS. Archived from the original on 16 January 2013. Retrieved 12 December 2012.
- ^ "Ethnic group - Office for National Statistics". www.ons.gov.uk. Retrieved 2022-11-30.
- ^ "Religion - Office for National Statistics". www.ons.gov.uk. Retrieved 2022-11-30.
- ^ "2001 census - theme tables". Retrieved 17 June 2015.
- ^ "Download:local authorities: county / unitary". NOMIS. Retrieved 17 June 2015.
- ^ "Religion - 2021 census". Office of National Statistics. 29 Nov 2022. Archived from the original on 29 Nov 2022. Retrieved 16 Dec 2022.
- ^ "Ward Overview Summary | Census 2021 - Overview | Manchester City Council".
- ^ "QS204EW (Main language (detailed)) - Nomis - Official Census and Labour Market Statistics". www.nomisweb.co.uk. Retrieved 2023-06-22.
- ^ "TS024 - Main language - Nomis - Official Census and Labour Market Statistics". www.nomisweb.co.uk. Retrieved 2023-06-22.
- ^ "TS060 - Industry - Nomis - Official Census and Labour Market Statistics". www.nomisweb.co.uk. Retrieved 2023-05-08.
- ^ "TS061 - Method used to travel to work - Nomis - Official Census and Labour Market Statistics". www.nomisweb.co.uk. Retrieved 2023-05-07.
- ^ "TS027 - National identity - UK - Nomis - Official Census and Labour Market Statistics". www.nomisweb.co.uk. Retrieved 2023-05-08.
- ^ "TS067 - Highest level of qualification - Nomis - Official Census and Labour Market Statistics". www.nomisweb.co.uk. Retrieved 2023-05-07.