
Mixdorf
Mixdorf | |
|---|---|
 Coat of arms | |
Location of Mixdorf within Oder-Spree district 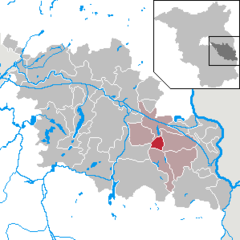 | |
 Mixdorf  Mixdorf | |
| Coordinates: 52°12′N 14°24′E / 52.200°N 14.400°E | |
| Country | Germany |
| State | Brandenburg |
| District | Oder-Spree |
| Municipal assoc. | Schlaubetal |
| Government | |
| • Mayor (2019–24) | Dieter-Lothar Mutke[1] |
| Area | |
| • Total | 13.03 km2 (5.03 sq mi) |
| Elevation | 61 m (200 ft) |
| Population (2022-12-31)[2] | |
| • Total | 924 |
| • Density | 71/km2 (180/sq mi) |
| Time zone | UTC+01:00 (CET) |
| • Summer (DST) | UTC+02:00 (CEST) |
| Postal codes | 15299 |
| Dialling codes | 033655 |
| Vehicle registration | LOS |
Mixdorf is a municipality in the Oder-Spree district, in Brandenburg, Germany.
History[edit]
From 1815 to 1947, Mixdorf was part of the Prussian Province of Brandenburg.
After World War II, Mixdorf was incorporated into the State of Brandenburg from 1947 to 1952 and the Bezirk Frankfurt of East Germany from 1952 to 1990. Since 1990, Mixdorf is again part of Brandenburg.
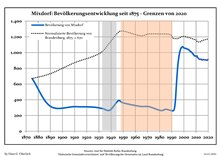
Demography[edit]
|
|
References[edit]
- ^ Landkreis Oder-Spree Wahl der Bürgermeisterin / des Bürgermeisters, accessed 2 July 2021.
- ^ "Bevölkerungsentwicklung und Bevölkerungsstandim Land Brandenburg Dezember 2022" (PDF). Amt für Statistik Berlin-Brandenburg (in German). June 2023.
- ^ Detailed data sources are to be found in the Wikimedia Commons.Population Projection Brandenburg at Wikimedia Commons
Towns and municipalities in Oder-Spree | ||
|---|---|---|
|  | |
This Brandenburg location article is a stub. You can help Wikipedia by expanding it. |