Portal:Maps/Selected article/15
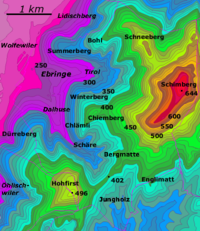
A contour line of a function of two variables is a curve along which the function has a constant value. In cartography, a contour line joins points of equal elevation above a given level, such as mean sea level. A contour map is a map illustrated with contour lines, for example a topographic map, which thus shows valleys and hills, and the steepness of slopes. The contour interval of a contour map is the difference in elevation between successive contour lines.
Contour lines are curved or straight lines on a map describing the intersection of a real or hypothetical surface with one or more horizontal planes. The configuration of these contours allows map readers to infer relative gradient of a parameter and estimate that parameter at specific places. Contour lines may be either traced on a visible three-dimensional model of the surface, as when a photogrammetrist viewing a stereo-model plots elevation contours, or interpolated from estimated surface elevations, as when a computer program threads contours through a network of observation points of area centroids. In the latter case, the method of interpolation affects the reliability of individual isolines and their portrayal of slope, pits and peaks.

