
Results of the 2019 Canadian federal election
| ||||||||||||||||||||||||||||||||||||||||||||
This lists parties that won seats. See the complete results below.
| ||||||||||||||||||||||||||||||||||||||||||||
_(48622478973)_(cropped)_(cropped)_(cropped).jpg)
The 2019 Canadian federal election was held on October 21, 2019, to elect members of the House of Commons to the 43rd Canadian Parliament. The Liberal Party of Canada, having previously held a majority of the seats in the House, was returned with a minority of the seats, while the Conservative Party of Canada gained fewer seats than expected and the Bloc Québécois saw its standing revived in Quebec.
In this election there were 18,170,880 valid votes cast with 179,479 voters rejected, for total voter turnout of 67 percent of the 27,373,028 registered voters.[1]
Summary[edit]


Campaign strategy was weak in most of the political parties. As one commentator remarked, "Never before have both major parties taken such a small share of the vote. Never before, in my memory, have both declined steadily and together throughout a campaign."[2] While the Conservative share of the vote rose from 31.9 percent in 2015 to 34.4 percent in 2019, and saw its share of the popular vote rise in 194 of the ridings, its share of the vote fell In the remaining 144.[a][3] The Liberals emerged from the election with a strategic advantage in seats in both Ontario and Quebec, and the Conservatives' weakness on election day may lead to questions about the future of its leader Andrew Scheer,[4][5] but there is also discussion as to whether the Tories' shortfall is due to more systemic reasons,[6][7][8] especially with respect to the urban/rural divide in the electorate.[9]
Opinion polling was generally accurate, although in most polls support for the Liberals and Conservatives was mildly understated, while that for the Bloc and the Greens was overstated.[10] Seats won fell within poll projections, but it was noted that at least eight seats expected to go to the NDP actually went Liberal, leading to the conjecture that the prior departure of their long-time NDP MPs revealed the underlying weakness of the party brand.[10]
Synopsis of results[edit]
| Results by riding - 2019 Canadian federal election[a 1] | |||||||||||||||||||
|---|---|---|---|---|---|---|---|---|---|---|---|---|---|---|---|---|---|---|---|
| Riding | Prov/ Terr |
2015 | Winning party | Turnout [a 2] |
Votes[a 3] | ||||||||||||||
| Party | Votes | Share | Margin # |
Margin % |
Lib | Con | NDP | BQ | Green | PPC | Ind | Other | Total | ||||||
| Banff—Airdrie | AB | Con | Con | 55,504 | 71.1% | 47,079 | 60.3% | 73.1% | 8,425 | 55,504 | 8,185 | – | 3,315 | 2,651 | – | – | 78,080 | ||
| Battle River—Crowfoot | AB | Con | Con | 53,309 | 85.5% | 50,124 | 80.4% | 77.3% | 2,557 | 53,309 | 3,185 | – | 1,689 | 1,620 | – | – | 62,360 | ||
| Bow River | AB | Con | Con | 46,279 | 83.9% | 43,106 | 78.2% | 70.1% | 3,173 | 46,279 | 3,086 | – | 826 | 1,321 | – | 453 | 55,138 | ||
| Calgary Centre | AB | Lib | Con | 37,306 | 56.6% | 19,535 | 29.7% | 69.4% | 17,771 | 37,306 | 6,516 | – | 2,853 | 907 | 138 | 373 | 65,864 | ||
| Calgary Confederation | AB | Con | Con | 36,312 | 55.1% | 21,404 | 32.5% | 72.2% | 14,908 | 36,312 | 7,312 | – | 5,700 | 1,136 | – | 524 | 65,892 | ||
| Calgary Forest Lawn | AB | Con | Con | 23,805 | 59.6% | 15,115 | 37.8% | 53.5% | 8,690 | 23,805 | 4,227 | – | 1,318 | 1,089 | 388 | 447 | 39,964 | ||
| Calgary Heritage | AB | Con | Con | 40,817 | 70.7% | 32,760 | 56.8% | 70.9% | 8,057 | 40,817 | 5,278 | – | 2,027 | 1,123 | 228 | 185 | 57,715 | ||
| Calgary Midnapore | AB | Con | Con | 50,559 | 74.3% | 43,052 | 63.2% | 73.2% | 7,507 | 50,559 | 6,445 | – | 1,992 | 1,585 | – | – | 68,088 | ||
| Calgary Nose Hill | AB | Con | Con | 38,588 | 69.8% | 29,885 | 54.0% | 66.9% | 8,703 | 38,588 | 5,304 | – | 1,554 | 1,089 | – | 71 | 55,309 | ||
| Calgary Rocky Ridge | AB | Con | Con | 48,253 | 68.3% | 35,241 | 49.9% | 72.3% | 13,012 | 48,253 | 6,051 | – | 2,011 | 1,053 | 270 | – | 70,650 | ||
| Calgary Shepard | AB | Con | Con | 58,614 | 75.0% | 49,970 | 63.9% | 70.2% | 8,644 | 58,614 | 6,828 | – | 2,345 | 1,709 | – | – | 78,140 | ||
| Calgary Signal Hill | AB | Con | Con | 44,421 | 70.0% | 34,699 | 54.7% | 72.1% | 9,722 | 44,421 | 5,355 | – | 2,139 | 1,130 | – | 711 | 63,478 | ||
| Calgary Skyview | AB | Lib | Con | 26,533 | 52.5% | 12,206 | 24.1% | 60.7% | 14,327 | 26,533 | 7,540 | – | 800 | 603 | – | 749 | 50,552 | ||
| Edmonton Centre | AB | Lib | Con | 22,006 | 41.4% | 4,482 | 8.4% | 65.4% | 17,524 | 22,006 | 10,959 | – | 1,394 | 805 | 119 | 285 | 53,092 | ||
| Edmonton Griesbach | AB | Con | Con | 24,120 | 51.4% | 12,320 | 26.2% | 57.5% | 8,100 | 24,120 | 11,800 | – | 1,189 | 1,074 | 216 | 464 | 46,963 | ||
| Edmonton Manning | AB | Con | Con | 30,425 | 55.9% | 18,733 | 34.4% | 61.5% | 11,692 | 30,425 | 9,555 | – | 1,255 | 1,109 | – | 344 | 54,380 | ||
| Edmonton Mill Woods | AB | Lib | Con | 26,736 | 50.3% | 8,857 | 16.7% | 69.0% | 17,879 | 26,736 | 6,422 | – | 968 | 953 | – | 219 | 53,177 | ||
| Edmonton Riverbend | AB | Con | Con | 35,126 | 57.4% | 21,088 | 34.5% | 71.0% | 14,038 | 35,126 | 9,332 | – | 1,797 | 855 | – | – | 61,148 | ||
| Edmonton Strathcona | AB | NDP | NDP | 26,823 | 47.3% | 5,788 | 10.2% | 73.7% | 6,592 | 21,035 | 26,823 | – | 1,152 | 941 | – | 202 | 56,745 | ||
| Edmonton West | AB | Con | Con | 35,719 | 60.9% | 23,907 | 40.8% | 66.6% | 11,812 | 35,719 | 8,537 | – | 1,441 | 1,126 | – | – | 58,635 | ||
| Edmonton—Wetaskiwin | AB | Con | Con | 63,346 | 72.4% | 52,544 | 60.1% | 71.4% | 10,802 | 63,346 | 9,820 | – | 1,660 | 1,616 | – | 211 | 87,455 | ||
| Foothills | AB | Con | Con | 53,872 | 82.1% | 50,016 | 76.3% | 76.6% | 3,856 | 53,872 | 3,767 | – | 2,398 | 1,698 | – | – | 65,591 | ||
| Fort McMurray—Cold Lake | AB | Con | Con | 40,706 | 79.9% | 35,858 | 70.3% | 65.6% | 4,848 | 40,706 | 2,883 | – | 865 | 1,674 | – | – | 50,976 | ||
| Grande Prairie-Mackenzie | AB | Con | Con | 51,198 | 84.0% | 46,953 | 77.0% | 72.4% | 2,910 | 51,198 | 4,245 | – | 1,134 | 1,492 | – | – | 60,979 | ||
| Lakeland | AB | Con | Con | 48,314 | 83.9% | 44,586 | 77.4% | 73.6% | 2,565 | 48,314 | 3,728 | – | 1,105 | 1,468 | – | 398 | 57,578 | ||
| Lethbridge | AB | Con | Con | 40,713 | 65.8% | 31,603 | 51.1% | 70.5% | 8,443 | 40,713 | 9,110 | – | 1,939 | 1,007 | – | 670 | 61,882 | ||
| Medicine Hat—Cardston—Warner | AB | Con | Con | 42,045 | 79.2% | 37,406 | 70.4% | 68.1% | 3,528 | 42,045 | 4,639 | – | 1,203 | 1,350 | 337 | – | 53,102 | ||
| Peace River—Westlock | AB | Con | Con | 41,659 | 80.7% | 37,773 | 73.1% | 70.4% | 3,148 | 41,659 | 3,886 | – | 1,377 | 1,579 | – | – | 51,649 | ||
| Red Deer—Lacombe | AB | Con | Con | 53,843 | 79.8% | 47,831 | 70.9% | 72.8% | 3,540 | 53,843 | 6,012 | – | 1,596 | 2,453 | – | – | 67,444 | ||
| Red Deer—Mountain View | AB | Con | Con | 54,765 | 80.3% | 49,819 | 73.1% | 76.8% | 3,795 | 54,765 | 4,946 | – | 2,026 | 2,637 | – | – | 68,169 | ||
| Sherwood Park—Fort Saskatchewan | AB | Con | Con | 53,600 | 73.4% | 44,733 | 61.2% | 77.0% | 7,357 | 53,600 | 8,867 | – | 1,592 | 1,334 | – | 300 | 73,050 | ||
| St. Albert—Edmonton | AB | Con | Con | 39,506 | 60.7% | 27,029 | 41.5% | 70.7% | 12,477 | 39,506 | 9,895 | – | 1,594 | 1,268 | – | 351 | 65,091 | ||
| Sturgeon River—Parkland | AB | Con | Con | 53,235 | 77.5% | 46,295 | 67.4% | 74.2% | 4,696 | 53,235 | 6,940 | – | 1,745 | 1,625 | – | 416 | 68,657 | ||
| Yellowhead | AB | Con | Con | 45,964 | 82.1% | 42,066 | 75.2% | 76.2% | 2,912 | 45,964 | 3,898 | – | 1,272 | 1,592 | – | 330 | 55,968 | ||
| Abbotsford | BC | Con | Con | 25,162 | 51.4% | 14,602 | 29.8% | 65.9% | 10,560 | 25,162 | 8,257 | – | 3,702 | 985 | – | 270 | 48,936 | ||
| Burnaby North—Seymour | BC | Lib | Lib | 17,770 | 35.5% | 1,585 | 3.2% | 65.4% | 17,770 | 9,734 | 16,185 | – | 4,801 | 1,079 | 271 | 219 | 50,059 | ||
| Burnaby South | BC | NDP | NDP | 16,956 | 37.7% | 3,042 | 6.8% | 56.9% | 10,706 | 13,914 | 16,956 | – | 2,477 | 645 | – | 308 | 45,006 | ||
| Cariboo—Prince George | BC | Con | Con | 28,848 | 52.7% | 17,916 | 32.7% | 65.5% | 10,932 | 28,848 | 8,440 | – | 4,998 | 1,206 | 350 | – | 54,774 | ||
| Central Okanagan—Similkameen—Nicola | BC | Con | Con | 31,135 | 47.9% | 14,883 | 22.9% | 69.2% | 16,252 | 31,135 | 10,904 | – | 5,086 | 1,345 | – | 213 | 64,935 | ||
| Chilliwack—Hope | BC | Con | Con | 26,672 | 49.6% | 15,824 | 29.4% | 65.7% | 10,848 | 26,672 | 8,957 | – | 5,243 | 1,760 | – | 275 | 53,755 | ||
| Cloverdale—Langley City | BC | Lib | Con | 20,936 | 37.7% | 1,394 | 2.5% | 65.0% | 19,542 | 20,936 | 10,508 | – | 3,572 | 930 | – | – | 55,488 | ||
| Coquitlam—Port Coquitlam | BC | Lib | Lib | 20,178 | 34.7% | 390 | 0.7% | 63.7% | 20,178 | 19,788 | 13,383 | – | 4,025 | 703 | – | 98 | 58,175 | ||
| Courtenay—Alberni | BC | NDP | NDP | 29,790 | 41.2% | 5,854 | 8.1% | 72.3% | 8,620 | 23,936 | 29,790 | – | 9,762 | – | – | 172 | 72,280 | ||
| Cowichan—Malahat—Langford | BC | NDP | NDP | 23,519 | 36.1% | 6,560 | 10.1% | 70.7% | 10,301 | 16,959 | 23,519 | – | 13,181 | 1,066 | – | 202 | 65,228 | ||
| Delta | BC | Lib | Lib | 22,257 | 41.2% | 4,448 | 8.2% | 70.7% | 22,257 | 17,809 | 8,792 | – | 3,387 | 948 | 783 | – | 53,976 | ||
| Esquimalt—Saanich—Sooke | BC | NDP | NDP | 23,887 | 34.1% | 5,381 | 7.7% | 70.9% | 12,554 | 13,409 | 23,887 | – | 18,506 | 1,089 | 282 | 398 | 70,125 | ||
| Fleetwood—Port Kells | BC | Lib | Lib | 18,545 | 37.7% | 1,899 | 3.9% | 61.5% | 18,401 | 16,518 | 10,533 | – | 2,360 | 1,093 | – | – | 48,905 | ||
| Kamloops—Thompson—Cariboo | BC | Con | Con | 32,415 | 44.7% | 12,699 | 17.5% | 70.8% | 19,716 | 32,415 | 9,936 | – | 8,789 | 1,132 | – | 465 | 72,453 | ||
| Kelowna—Lake Country | BC | Lib | Con | 31,497 | 45.6% | 8,870 | 12.8% | 69.4% | 22,627 | 31,497 | 8,381 | – | 5,171 | 1,225 | 219 | – | 69,120 | ||
| Kootenay—Columbia | BC | NDP | Con | 30,168 | 44.8% | 7,019 | 10.4% | 73.8% | 6,151 | 30,168 | 23,149 | – | 6,145 | 1,378 | – | 339 | 67,330 | ||
| Langley—Aldergrove | BC | Con | Con | 29,823 | 47.0% | 13,569 | 21.4% | 68.9% | 16,254 | 29,823 | 10,690 | – | 4,881 | 1,305 | – | 499 | 63,452 | ||
| Mission—Matsqui—Fraser Canyon | BC | Lib | Con | 19,535 | 42.4% | 7,236 | 15.7% | 67.2% | 12,299 | 19,535 | 8,089 | – | 5,019 | 1,055 | – | 69 | 46,066 | ||
| Nanaimo—Ladysmith | BC | NDP | Grn | 24,844 | 34.6% | 6,210 | 8.6% | 69.5% | 9,735 | 18,634 | 16,985 | – | 24,844 | 1,049 | 306 | 311 | 71,864 | ||
| New Westminster—Burnaby | BC | NDP | NDP | 23,437 | 44.2% | 11,023 | 20.8% | 62.3% | 12,414 | 11,439 | 23,437 | – | 4,378 | 862 | 83 | 364 | 52,977 | ||
| North Island—Powell River | BC | NDP | NDP | 23,834 | 37.9% | 3,332 | 5.3% | 70.6% | 8,251 | 20,502 | 23,834 | – | 8,891 | 1,102 | 287 | 48 | 62,915 | ||
| North Okanagan—Shuswap | BC | Con | Con | 36,154 | 48.8% | 19,371 | 26.1% | 70.0% | 16,783 | 36,154 | 11,353 | – | 7,828 | 2,027 | – | – | 74,145 | ||
| North Vancouver | BC | Lib | Lib | 26,979 | 42.9% | 10,071 | 16.0% | 71.7% | 26,979 | 16,908 | 10,340 | – | 7,868 | 835 | – | – | 62,930 | ||
| Pitt Meadows—Maple Ridge | BC | Lib | Con | 19,650 | 36.2% | 3,525 | 6.5% | 68.2% | 16,125 | 19,650 | 12,958 | – | 4,332 | 698 | 468 | – | 54,231 | ||
| Port Moody—Coquitlam | BC | NDP | Con | 16,855 | 31.2% | 153 | 0.3% | 66.4% | 15,695 | 16,855 | 16,702 | – | 3,873 | 821 | – | 57 | 54,003 | ||
| Prince George—Peace River—Northern Rockies | BC | Con | Con | 38,473 | 69.8% | 32,082 | 58.2% | 69.8% | 6,391 | 38,473 | 5,069 | – | 3,448 | 1,748 | – | – | 55,129 | ||
| Richmond Centre | BC | Con | Con | 19,037 | 49.0% | 7,985 | 20.6% | 53.4% | 11,052 | 19,037 | 5,617 | – | 2,376 | 538 | 197 | – | 38,817 | ||
| Saanich—Gulf Islands | BC | Grn | Grn | 33,454 | 49.1% | 19,670 | 28.9% | 75.5% | 11,326 | 13,784 | 8,657 | – | 33,454 | 929 | – | – | 68,150 | ||
| Skeena—Bulkley Valley | BC | NDP | NDP | 16,944 | 40.9% | 3,188 | 7.7% | 62.7% | 4,793 | 13,756 | 16,944 | – | 3,280 | 940 | 321 | 1,350 | 41,384 | ||
| South Okanagan—West Kootenay | BC | NDP | NDP | 24,809 | 36.4% | 796 | 1.2% | 69.6% | 11,705 | 24,013 | 24,809 | – | 5,672 | 1,638 | 359 | – | 68,196 | ||
| South Surrey—White Rock | BC | Con | Con | 24,310 | 41.9% | 2,618 | 4.5% | 69.6% | 21,692 | 24,310 | 6,716 | – | 4,458 | 852 | – | – | 58,028 | ||
| Steveston—Richmond East | BC | Lib | Con | 17,478 | 41.7% | 2,747 | 6.5% | 57.4% | 14,731 | 17,478 | 6,321 | – | 2,972 | – | 449 | – | 41,951 | ||
| Surrey Centre | BC | Lib | Lib | 15,453 | 37.4% | 4,100 | 9.9% | 54.9% | 15,453 | 10,505 | 11,353 | – | 2,558 | 709 | 243 | 498 | 41,319 | ||
| Surrey—Newton | BC | Lib | Lib | 18,960 | 45.0% | 6,654 | 15.8% | 63.4% | 18,960 | 8,824 | 12,306 | – | 1,355 | 653 | – | – | 42,098 | ||
| Vancouver Centre | BC | Lib | Lib | 23,599 | 42.2% | 10,319 | 18.4% | 61.5% | 23,599 | 10,782 | 13,280 | – | 7,002 | 724 | 180 | 379 | 55,946 | ||
| Vancouver East | BC | NDP | NDP | 29,236 | 52.6% | 19,151 | 34.4% | 61.1% | 10,085 | 6,724 | 29,236 | – | 8,062 | 679 | – | 825 | 55,611 | ||
| Vancouver Granville | BC | Lib | Ind | 17,265 | 32.6% | 3,177 | 6.0% | 65.0% | 14,088 | 11,605 | 6,960 | – | 2,683 | 431 | 17,265 | – | 53,032 | ||
| Vancouver Kingsway | BC | NDP | NDP | 21,680 | 49.1% | 11,486 | 26.0% | 59.4% | 10,194 | 8,804 | 21,680 | – | 2,675 | 427 | – | 91 | 44,163 | ||
| Vancouver Quadra | BC | Lib | Lib | 22,093 | 43.5% | 8,011 | 15.8% | 68.0% | 22,093 | 14,082 | 7,681 | – | 6,308 | 428 | 162 | – | 50,754 | ||
| Vancouver South | BC | Lib | Lib | 17,808 | 41.2% | 3,420 | 7.9% | 58.9% | 17,808 | 14,388 | 8,015 | – | 2,451 | 532 | – | – | 43,194 | ||
| Victoria | BC | NDP | NDP | 23,765 | 33.2% | 2,382 | 3.3% | 73.5% | 15,952 | 9,038 | 23,765 | – | 21,383 | 920 | 111 | 380 | 71,549 | ||
| West Vancouver—Sunshine Coast—Sea to Sky Country | BC | Lib | Lib | 22,673 | 34.9% | 5,314 | 8.2% | 69.1% | 22,673 | 17,359 | 9,027 | – | 14,579 | 1,010 | 159 | 173 | 64,980 | ||
| Brandon—Souris | MB | Con | Con | 26,148 | 63.5% | 20,343 | 49.4% | 66.4% | 4,972 | 26,148 | 5,805 | – | 2,984 | 691 | 326 | 280 | 41,206 | ||
| Charleswood—St. James—Assiniboia—Headingley | MB | Lib | Con | 18,815 | 40.7% | 2,417 | 5.2% | 71.1% | 16,398 | 18,815 | 6,556 | – | 2,178 | 1,975 | 140 | 166 | 46,228 | ||
| Churchill—Keewatinook Aski | MB | NDP | NDP | 11,919 | 50.3% | 6,303 | 26.6% | 48.8% | 5,616 | 4,714 | 11,919 | – | 1,144 | 294 | – | – | 23,687 | ||
| Dauphin—Swan River—Neepawa | MB | Con | Con | 26,103 | 64.3% | 20,379 | 50.2% | 66.2% | 5,344 | 26,103 | 5,724 | – | 2,214 | 711 | – | 470 | 40,566 | ||
| Elmwood—Transcona | MB | NDP | NDP | 19,786 | 45.6% | 3,546 | 8.2% | 62.8% | 5,346 | 16,240 | 19,786 | – | 1,480 | 512 | – | – | 43,364 | ||
| Kildonan—St. Paul | MB | Lib | Con | 19,856 | 44.8% | 7,500 | 16.9% | 67.7% | 12,356 | 19,856 | 9,387 | – | 1,777 | 510 | 108 | 304 | 44,298 | ||
| Portage—Lisgar | MB | Con | Con | 31,600 | 70.8% | 26,821 | 60.1% | 68.5% | 4,779 | 31,600 | 3,872 | – | 2,356 | 1,169 | – | 860 | 44,636 | ||
| Provencher | MB | Con | Con | 31,821 | 65.9% | 25,474 | 52.7% | 70.5% | 6,347 | 31,821 | 6,187 | – | 2,884 | 1,066 | – | – | 48,305 | ||
| Saint Boniface—Saint Vital | MB | Lib | Lib | 20,300 | 42.9% | 4,864 | 10.3% | 69.9% | 20,300 | 15,436 | 8,037 | – | 2,671 | 591 | 303 | – | 47,338 | ||
| Selkirk—Interlake—Eastman | MB | Con | Con | 31,109 | 62.7% | 22,236 | 44.8% | 68.7% | 6,003 | 31,109 | 8,873 | – | 2,934 | 683 | – | – | 49,602 | ||
| Winnipeg Centre | MB | Lib | NDP | 13,073 | 41.2% | 2,369 | 7.5% | 54.2% | 10,704 | 5,561 | 13,073 | – | 1,661 | 474 | – | 251 | 31,724 | ||
| Winnipeg North | MB | Lib | Lib | 15,581 | 47.6% | 7,112 | 21.7% | 52.4% | 15,581 | 6,820 | 8,469 | – | 905 | 324 | 231 | 404 | 32,735 | ||
| Winnipeg South | MB | Lib | Lib | 20,182 | 42.1% | 1,645 | 3.4% | 69.9% | 20,182 | 18,537 | 6,678 | – | 2,073 | 419 | – | – | 47,889 | ||
| Winnipeg South Centre | MB | Lib | Lib | 22,799 | 45.0% | 7,748 | 15.3% | 71.6% | 22,799 | 15,051 | 8,965 | – | 3,173 | 569 | – | 104 | 50,661 | ||
| Acadie—Bathurst | NB | Lib | Lib | 26,547 | 55.1% | 16,195 | 33.6% | 73.5% | 26,547 | 10,352 | 6,967 | – | 4,277 | – | – | – | 48,143 | ||
| Beauséjour | NB | Lib | Lib | 24,948 | 46.5% | 10,643 | 19.8% | 78.0% | 24,948 | 9,438 | 3,940 | – | 14,305 | 1,054 | – | – | 53,685 | ||
| Fredericton | NB | Lib | Grn | 16,640 | 33.7% | 1,629 | 3.3% | 75.5% | 13,544 | 15,011 | 2,946 | – | 16,640 | 776 | – | 492 | 49,409 | ||
| Fundy Royal | NB | Lib | Con | 22,389 | 46.0% | 9,956 | 20.5% | 75.4% | 12,433 | 22,389 | 4,804 | – | 7,275 | 1,249 | 295 | 201 | 48,646 | ||
| Madawaska—Restigouche | NB | Lib | Lib | 17,331 | 50.3% | 7,530 | 21.8% | 69.4% | 17,331 | 9,801 | 2,212 | – | 5,125 | – | – | – | 34,469 | ||
| Miramichi—Grand Lake | NB | Lib | Lib | 12,722 | 36.8% | 370 | 1.1% | 72.8% | 12,722 | 12,352 | 2,875 | – | 3,914 | 1,179 | 1,556 | – | 34,598 | ||
| Moncton—Riverview—Dieppe | NB | Lib | Lib | 22,261 | 43.0% | 10,061 | 19.4% | 70.0% | 22,261 | 12,200 | 6,164 | – | 9,287 | 1,258 | – | 658 | 51,828 | ||
| New Brunswick Southwest | NB | Lib | Con | 19,451 | 49.1% | 9,341 | 23.6% | 74.5% | 10,110 | 19,451 | 3,251 | – | 5,352 | 1,214 | – | 200 | 39,578 | ||
| Saint John—Rothesay | NB | Lib | Lib | 15,443 | 37.4% | 1,437 | 3.5% | 65.5% | 15,443 | 14,006 | 5,046 | – | 4,165 | 1,260 | 1,333 | – | 41,253 | ||
| Tobique—Mactaquac | NB | Lib | Con | 19,229 | 50.3% | 9,598 | 25.1% | 70.0% | 9,631 | 19,229 | 3,007 | – | 5,398 | 936 | – | – | 38,201 | ||
| Avalon | NL | Lib | Lib | 19,122 | 46.3% | 6,267 | 15.2% | 60.4% | 19,122 | 12,855 | 7,142 | – | 2,215 | – | – | – | 41,334 | ||
| Bonavista—Burin—Trinity | NL | Lib | Lib | 14,707 | 45.7% | 2,010 | 6.2% | 55.8% | 14,707 | 12,697 | 3,855 | – | 920 | – | – | – | 32,179 | ||
| Coast of Bays—Central—Notre Dame | NL | Lib | Lib | 16,514 | 48.3% | 4,433 | 13.0% | 55.6% | 16,514 | 12,081 | 4,224 | – | 1,363 | – | – | – | 34,182 | ||
| Labrador | NL | Lib | Lib | 4,851 | 42.5% | 1,303 | 11.4% | 57.7% | 4,851 | 3,548 | 2,796 | – | 224 | – | – | – | 11,419 | ||
| Long Range Mountains | NL | Lib | Lib | 18,199 | 47.4% | 7,326 | 19.1% | 56.2% | 18,199 | 10,873 | 7,609 | – | 1,334 | – | – | 411 | 38,426 | ||
| St. John's East | NL | Lib | NDP | 21,148 | 46.9% | 6,186 | 13.7% | 69.0% | 14,962 | 8,141 | 21,148 | – | 821 | – | – | – | 45,072 | ||
| St. John's South—Mount Pearl | NL | Lib | Lib | 20,793 | 51.1% | 9,903 | 24.4% | 61.4% | 20,793 | 7,767 | 10,890 | – | 740 | 335 | – | 141 | 40,666 | ||
| Cape Breton—Canso | NS | Lib | Lib | 16,694 | 38.9% | 1,873 | 4.4% | 72.1% | 16,694 | 14,821 | 6,354 | – | 3,321 | 925 | 685 | 140 | 42,940 | ||
| Central Nova | NS | Lib | Lib | 20,718 | 46.6% | 7,517 | 16.9% | 74.5% | 20,718 | 13,201 | 5,806 | – | 3,478 | 938 | 149 | 180 | 44,470 | ||
| Cumberland—Colchester | NS | Lib | Lib | 16,672 | 36.7% | 453 | 1.0% | 68.9% | 16,672 | 16,219 | 5,451 | – | 6,015 | 608 | 232 | 253 | 45,450 | ||
| Dartmouth—Cole Harbour | NS | Lib | Lib | 24,259 | 45.3% | 9,824 | 18.4% | 70.0% | 24,259 | 8,638 | 14,435 | – | 5,280 | 887 | – | – | 53,499 | ||
| Halifax | NS | Lib | Lib | 23,681 | 42.5% | 6,934 | 12.4% | 75.0% | 23,681 | 6,456 | 16,747 | – | 8,013 | 633 | – | 222 | 55,752 | ||
| Halifax West | NS | Lib | Lib | 26,885 | 49.5% | 16,397 | 30.2% | 71.1% | 26,885 | 10,488 | 10,429 | – | 6,555 | – | – | – | 54,357 | ||
| Kings—Hants | NS | Lib | Lib | 20,806 | 43.3% | 8,901 | 18.5% | 69.5% | 20,806 | 11,905 | 8,254 | – | 6,029 | 786 | – | 256 | 48,036 | ||
| Sackville—Preston—Chezzetcook | NS | Lib | Lib | 19,925 | 40.2% | 8,065 | 16.3% | 69.8% | 19,925 | 11,211 | 11,860 | – | 5,725 | 816 | – | – | 49,537 | ||
| South Shore—St. Margarets | NS | Lib | Lib | 21,886 | 41.7% | 7,142 | 13.6% | 67.7% | 21,886 | 14,744 | 8,361 | – | 6,070 | 667 | 541 | 249 | 52,518 | ||
| Sydney—Victoria | NS | Lib | Lib | 12,536 | 30.9% | 1,309 | 3.2% | 68.4% | 12,536 | 11,227 | 8,146 | – | 2,249 | – | 6,159 | 248 | 40,565 | ||
| West Nova | NS | Lib | Con | 18,390 | 39.3% | 1,365 | 2.9% | 67.7% | 17,025 | 18,390 | 5,010 | – | 5,939 | – | – | 434 | 46,798 | ||
| Ajax | ON | Lib | Lib | 35,198 | 57.7% | 19,334 | 31.7% | 66.3% | 35,198 | 15,864 | 7,033 | – | 2,040 | 588 | 297 | – | 61,020 | ||
| Algoma—Manitoulin—Kapuskasing | ON | NDP | NDP | 16,883 | 41.6% | 6,258 | 15.4% | 62.6% | 9,879 | 10,625 | 16,883 | – | 2,192 | 887 | – | 125 | 40,591 | ||
| Aurora—Oak Ridges—Richmond Hill | ON | Lib | Con | 23,568 | 44.4% | 1,060 | 2.0% | 64.4% | 22,508 | 23,568 | 3,820 | – | 2,154 | 530 | – | 529 | 53,109 | ||
| Barrie—Innisfil | ON | Con | Con | 23,765 | 43.8% | 7,886 | 14.5% | 63.0% | 15,879 | 23,765 | 8,880 | – | 4,716 | 1,013 | – | – | 54,253 | ||
| Barrie—Springwater—Oro-Medonte | ON | Con | Con | 20,981 | 39.0% | 4,176 | 7.8% | 66.9% | 16,805 | 20,981 | 7,972 | – | 7,066 | 969 | – | – | 53,793 | ||
| Bay of Quinte | ON | Lib | Lib | 24,099 | 39.2% | 1,449 | 2.4% | 66.1% | 24,099 | 22,650 | 9,851 | – | 3,740 | 1,207 | – | – | 61,547 | ||
| Beaches—East York | ON | Lib | Lib | 32,647 | 57.2% | 20,451 | 35.8% | 70.9% | 32,647 | 8,026 | 12,196 | – | 3,378 | 831 | – | – | 57,078 | ||
| Brampton Centre | ON | Lib | Lib | 18,771 | 47.2% | 8,075 | 20.3% | 59.8% | 18,771 | 10,696 | 7,819 | – | 1,685 | 681 | – | 106 | 39,758 | ||
| Brampton East | ON | Lib | Lib | 24,050 | 47.4% | 10,682 | 21.0% | 66.4% | 24,050 | 12,125 | 13,368 | – | 666 | 244 | 211 | 89 | 50,753 | ||
| Brampton North | ON | Lib | Lib | 25,970 | 51.4% | 11,997 | 23.8% | 65.9% | 25,970 | 13,973 | 8,533 | – | 1,516 | 510 | – | – | 50,502 | ||
| Brampton South | ON | Lib | Lib | 24,085 | 49.5% | 10,257 | 21.1% | 62.8% | 24,085 | 13,828 | 7,985 | – | 1,926 | 354 | – | 505 | 48,683 | ||
| Brampton West | ON | Lib | Lib | 28,743 | 53.5% | 15,919 | 29.7% | 62.6% | 28,743 | 12,824 | 9,855 | – | 1,271 | 505 | – | 485 | 53,683 | ||
| Brantford—Brant | ON | Con | Con | 26,849 | 40.3% | 6,395 | 9.6% | 62.2% | 20,454 | 26,849 | 13,131 | – | 4,257 | 1,320 | 261 | 394 | 66,666 | ||
| Bruce—Grey—Owen Sound | ON | Con | Con | 26,830 | 46.1% | 9,345 | 16.1% | 65.6% | 17,485 | 26,830 | 6,797 | – | 5,114 | 1,614 | – | 321 | 58,161 | ||
| Burlington | ON | Lib | Lib | 34,989 | 48.4% | 11,059 | 15.4% | 72.6% | 34,989 | 23,930 | 7,372 | – | 4,750 | 944 | – | – | 71,985 | ||
| Cambridge | ON | Lib | Lib | 22,903 | 39.5% | 5,494 | 9.5% | 64.9% | 22,903 | 17,409 | 11,177 | – | 4,343 | 1,872 | – | 238 | 57,942 | ||
| Carleton | ON | Con | Con | 32,147 | 46.3% | 5,629 | 8.1% | 79.5% | 26,518 | 32,147 | 6,479 | – | 3,423 | 792 | – | – | 69,359 | ||
| Chatham-Kent—Leamington | ON | Con | Con | 25,359 | 46.9% | 8,460 | 15.6% | 63.3% | 16,899 | 25,359 | 8,229 | – | 2,233 | 1,061 | – | 307 | 54,088 | ||
| Davenport | ON | Lib | Lib | 23,251 | 43.7% | 1,439 | 2.7% | 67.1% | 23,251 | 4,921 | 21,812 | – | 2,397 | 496 | 165 | 138 | 53,180 | ||
| Don Valley East | ON | Lib | Lib | 25,295 | 59.8% | 15,180 | 35.9% | 49.8% | 25,295 | 10,115 | 4,647 | – | 1,675 | 562 | – | – | 42,294 | ||
| Don Valley North | ON | Lib | Lib | 23,495 | 50.4% | 6,989 | 15.0% | 62.0% | 23,495 | 16,506 | 4,285 | – | 1,803 | 482 | – | – | 46,571 | ||
| Don Valley West | ON | Lib | Lib | 29,148 | 55.8% | 12,844 | 24.6% | 71.5% | 29,148 | 16,304 | 3,804 | – | 2,257 | 444 | – | 277 | 52,234 | ||
| Dufferin—Caledon | ON | Con | Con | 28,852 | 42.0% | 6,207 | 9.0% | 65.1% | 22,645 | 28,852 | 7,981 | – | 7,303 | 1,516 | – | 319 | 68,616 | ||
| Durham | ON | Con | Con | 30,752 | 42.1% | 7,205 | 9.9% | 68.5% | 23,547 | 30,752 | 13,323 | – | 3,950 | 1,442 | – | – | 73,014 | ||
| Eglinton—Lawrence | ON | Lib | Lib | 29,850 | 53.3% | 11,301 | 20.2% | 68.1% | 29,850 | 18,549 | 4,741 | – | 2,278 | 586 | – | – | 56,004 | ||
| Elgin—Middlesex—London | ON | Con | Con | 31,026 | 50.2% | 16,702 | 27.0% | 66.7% | 14,324 | 31,026 | 11,019 | – | 3,562 | 956 | – | 867 | 61,754 | ||
| Essex | ON | NDP | Con | 28,274 | 41.4% | 4,671 | 6.8% | 67.3% | 12,987 | 28,274 | 23,603 | – | 2,173 | 1,251 | – | – | 68,288 | ||
| Etobicoke Centre | ON | Lib | Lib | 32,800 | 51.9% | 10,996 | 17.4% | 69.5% | 32,800 | 21,804 | 4,881 | – | 2,775 | 664 | – | 295 | 63,219 | ||
| Etobicoke North | ON | Lib | Lib | 26,388 | 61.4% | 16,864 | 39.3% | 58.8% | 26,388 | 9,524 | 4,654 | – | 1,080 | 1,196 | – | 104 | 42,946 | ||
| Etobicoke—Lakeshore | ON | Lib | Lib | 36,061 | 51.9% | 16,109 | 23.2% | 68.0% | 36,061 | 19,952 | 8,277 | – | 4,141 | 921 | – | 163 | 69,515 | ||
| Flamborough—Glanbrook | ON | Con | Con | 24,527 | 39.2% | 1,652 | 2.6% | 70.5% | 22,875 | 24,527 | 10,322 | – | 3,833 | 982 | – | – | 62,539 | ||
| Glengarry—Prescott—Russell | ON | Lib | Lib | 31,293 | 47.4% | 7,633 | 11.6% | 72.2% | 31,293 | 23,660 | 6,851 | – | 2,113 | 1,174 | 239 | 461 | 65,791 | ||
| Guelph | ON | Lib | Lib | 30,497 | 40.4% | 11,261 | 14.9% | 72.3% | 30,497 | 14,568 | 9,297 | – | 19,236 | 1,087 | 219 | 664 | 75,568 | ||
| Haldimand—Norfolk | ON | Con | Con | 28,018 | 46.8% | 13,314 | 22.2% | 66.3% | 14,704 | 28,018 | 9,192 | – | 4,878 | 1,234 | – | 1,900 | 59,926 | ||
| Haliburton—Kawartha Lakes—Brock | ON | Con | Con | 32,257 | 49.1% | 15,190 | 23.1% | 66.9% | 17,067 | 32,257 | 9,676 | – | 5,515 | 1,245 | – | – | 65,760 | ||
| Hamilton Centre | ON | NDP | NDP | 20,368 | 46.2% | 7,717 | 17.5% | 60.3% | 12,651 | 6,341 | 20,368 | – | 3,370 | 833 | 377 | 182 | 44,122 | ||
| Hamilton East—Stoney Creek | ON | Lib | Lib | 20,112 | 38.6% | 5,182 | 9.9% | 62.2% | 20,112 | 13,130 | 14,930 | – | 2,902 | 1,072 | – | – | 52,146 | ||
| Hamilton Mountain | ON | NDP | NDP | 19,135 | 36.1% | 3,078 | 5.8% | 66.0% | 16,057 | 13,443 | 19,135 | – | 3,115 | 760 | – | 439 | 52,949 | ||
| Hamilton West—Ancaster—Dundas | ON | Lib | Lib | 30,214 | 46.6% | 12,874 | 19.8% | 74.6% | 30,214 | 17,340 | 11,527 | – | 4,770 | 894 | – | 156 | 64,901 | ||
| Hastings—Lennox and Addington | ON | Lib | Con | 21,968 | 41.4% | 2,247 | 4.2% | 66.7% | 19,721 | 21,968 | 6,984 | – | 3,114 | 1,307 | – | – | 53,094 | ||
| Humber River—Black Creek | ON | Lib | Lib | 23,187 | 61.1% | 15,989 | 42.1% | 56.8% | 23,187 | 6,164 | 7,198 | – | 804 | 402 | – | 203 | 37,958 | ||
| Huron—Bruce | ON | Con | Con | 29,512 | 48.5% | 9,345 | 15.4% | 71.1% | 20,167 | 29,512 | 7,421 | – | 2,665 | 1,102 | – | – | 60,867 | ||
| Kanata—Carleton | ON | Lib | Lib | 28,746 | 43.1% | 4,385 | 6.6% | 77.4% | 28,746 | 24,361 | 8,317 | – | 4,387 | 961 | – | – | 66,772 | ||
| Kenora | ON | Lib | Con | 9,445 | 34.0% | 1,110 | 4.0% | 61.4% | 8,335 | 9,445 | 7,923 | – | 1,526 | 388 | 170 | – | 27,787 | ||
| Kingston and the Islands | ON | Lib | Lib | 31,205 | 45.8% | 15,349 | 22.5% | 70.5% | 31,205 | 13,304 | 15,856 | – | 6,059 | 1,769 | – | – | 68,193 | ||
| King—Vaughan | ON | Lib | Lib | 28,725 | 45.0% | 1,141 | 1.8% | 64.9% | 28,725 | 27,584 | 4,297 | – | 2,511 | 731 | – | – | 63,848 | ||
| Kitchener Centre | ON | Lib | Lib | 20,316 | 36.7% | 5,922 | 10.7% | 67.1% | 20,316 | 13,191 | 6,238 | – | 14,394 | 1,033 | – | 202 | 55,374 | ||
| Kitchener South—Hespeler | ON | Lib | Lib | 20,986 | 40.2% | 3,506 | 6.7% | 66.0% | 20,986 | 17,480 | 6,945 | – | 5,671 | 1,005 | – | 146 | 52,233 | ||
| Kitchener—Conestoga | ON | Con | Lib | 20,480 | 39.7% | 365 | 0.7% | 69.6% | 20,480 | 20,115 | 5,204 | – | 4,946 | 790 | – | – | 51,535 | ||
| Lambton—Kent—Middlesex | ON | Con | Con | 28,651 | 49.0% | 13,837 | 23.7% | 66.6% | 14,814 | 28,651 | 9,355 | – | 3,463 | 1,804 | – | 325 | 58,412 | ||
| Lanark—Frontenac—Kingston | ON | Con | Con | 30,077 | 48.1% | 14,636 | 23.4% | 72.5% | 15,441 | 30,077 | 8,835 | – | 7,011 | 1,117 | – | – | 62,481 | ||
| Leeds—Grenville—Thousand Islands and Rideau Lakes | ON | Con | Con | 28,630 | 49.0% | 13,148 | 22.5% | 69.8% | 15,482 | 28,630 | 8,201 | – | 5,152 | 988 | – | – | 58,453 | ||
| London North Centre | ON | Lib | Lib | 27,247 | 42.7% | 12,181 | 19.1% | 67.3% | 27,247 | 15,066 | 14,887 | – | 4,872 | 1,532 | – | 137 | 63,741 | ||
| London West | ON | Lib | Lib | 30,622 | 43.0% | 10,712 | 15.0% | 72.0% | 30,622 | 19,910 | 15,220 | – | 3,827 | 1,171 | – | 523 | 71,273 | ||
| London—Fanshawe | ON | NDP | NDP | 22,671 | 40.8% | 7,747 | 13.9% | 60.4% | 14,924 | 13,770 | 22,671 | – | 2,781 | 1,132 | 297 | – | 55,575 | ||
| Markham—Stouffville | ON | Lib | Lib | 25,055 | 38.9% | 5,352 | 8.3% | 68.4% | 25,055 | 19,703 | 4,132 | – | 1,621 | 537 | 13,340 | – | 64,388 | ||
| Markham—Thornhill | ON | Lib | Lib | 24,124 | 53.9% | 8,650 | 19.3% | 62.8% | 23,899 | 15,319 | 3,233 | – | 1,247 | 357 | 276 | – | 44,331 | ||
| Markham—Unionville | ON | Con | Con | 26,133 | 48.9% | 5,649 | 10.6% | 60.9% | 20,484 | 26,133 | 3,524 | – | 2,394 | 861 | – | – | 53,396 | ||
| Milton | ON | Con | Lib | 30,882 | 51.7% | 9,318 | 15.6% | 70.8% | 30,882 | 21,564 | 3,851 | – | 2,769 | 613 | – | – | 59,679 | ||
| Mississauga Centre | ON | Lib | Lib | 29,974 | 55.8% | 14,100 | 26.2% | 62.3% | 29,974 | 15,874 | 5,173 | – | 1,646 | 837 | 252 | – | 53,756 | ||
| Mississauga East—Cooksville | ON | Lib | Lib | 27,923 | 53.1% | 10,259 | 19.5% | 62.1% | 27,923 | 17,664 | 4,643 | – | 1,578 | 637 | – | 178 | 52,623 | ||
| Mississauga—Erin Mills | ON | Lib | Lib | 31,181 | 53.5% | 12,131 | 20.8% | 66.6% | 31,181 | 19,050 | 5,236 | – | 2,147 | 648 | – | – | 58,262 | ||
| Mississauga—Lakeshore | ON | Lib | Lib | 29,526 | 48.4% | 6,786 | 11.1% | 68.2% | 29,526 | 22,740 | 5,103 | – | 2,814 | 717 | – | 99 | 60,999 | ||
| Mississauga—Malton | ON | Lib | Lib | 27,890 | 57.5% | 15,362 | 31.7% | 62.0% | 27,890 | 12,528 | 6,103 | – | 1,251 | 369 | – | 396 | 48,537 | ||
| Mississauga—Streetsville | ON | Lib | Lib | 29,618 | 50.4% | 10,144 | 17.3% | 67.6% | 29,618 | 19,474 | 6,036 | – | 2,688 | 706 | – | 243 | 58,765 | ||
| Nepean | ON | Lib | Lib | 31,933 | 45.9% | 8,613 | 12.4% | 75.2% | 31,933 | 23,320 | 9,104 | – | 4,379 | 687 | – | 160 | 69,583 | ||
| Newmarket—Aurora | ON | Lib | Lib | 26,488 | 43.1% | 3,236 | 5.3% | 67.3% | 26,488 | 23,252 | 6,576 | – | 3,551 | 588 | – | 1,005 | 61,460 | ||
| Niagara Centre | ON | Lib | Lib | 20,292 | 35.0% | 2,305 | 4.0% | 64.9% | 20,292 | 17,987 | 15,469 | – | 3,054 | 776 | – | 385 | 57,963 | ||
| Niagara Falls | ON | Con | Con | 24,751 | 35.5% | 2,061 | 3.0% | 62.3% | 22,690 | 24,751 | 12,566 | – | 3,404 | 968 | 4,997 | 358 | 69,734 | ||
| Niagara West | ON | Con | Con | 24,447 | 45.3% | 7,018 | 13.0% | 72.5% | 17,429 | 24,447 | 6,540 | – | 3,620 | 869 | – | 1,019 | 53,924 | ||
| Nickel Belt | ON | Lib | Lib | 19,046 | 39.0% | 3,390 | 6.9% | 64.7% | 19,046 | 10,343 | 15,656 | – | 2,644 | 1,159 | – | – | 48,848 | ||
| Nipissing—Timiskaming | ON | Lib | Lib | 19,352 | 40.5% | 6,368 | 13.3% | 64.6% | 19,352 | 12,984 | 9,784 | – | 3,111 | 2,496 | – | – | 47,727 | ||
| Northumberland—Peterborough South | ON | Lib | Con | 27,385 | 39.7% | 2,408 | 3.5% | 71.7% | 24,977 | 27,385 | 9,615 | – | 5,524 | 1,460 | – | – | 68,961 | ||
| Oakville | ON | Lib | Lib | 30,265 | 46.3% | 4,704 | 7.2% | 73.1% | 30,265 | 25,561 | 4,928 | – | 3,704 | 798 | – | 145 | 65,401 | ||
| Oakville North—Burlington | ON | Lib | Lib | 33,597 | 48.3% | 7,113 | 10.2% | 71.9% | 33,597 | 26,484 | 5,866 | – | 2,925 | 751 | – | – | 69,623 | ||
| Orléans | ON | Lib | Lib | 44,183 | 54.3% | 21,199 | 26.0% | 77.3% | 44,183 | 22,984 | 9,428 | – | 3,829 | 986 | – | – | 81,410 | ||
| Oshawa | ON | Con | Con | 24,087 | 38.9% | 6,419 | 10.4% | 61.5% | 15,750 | 24,087 | 17,668 | – | 3,151 | 1,215 | – | 112 | 61,983 | ||
| Ottawa Centre | ON | Lib | Lib | 38,391 | 48.7% | 15,575 | 19.7% | 80.1% | 38,391 | 9,920 | 22,916 | – | 5,837 | 720 | 242 | 876 | 78,902 | ||
| Ottawa South | ON | Lib | Lib | 34,205 | 52.3% | 18,180 | 27.8% | 72.0% | 34,205 | 16,025 | 10,457 | – | 3,645 | 717 | 228 | 99 | 65,376 | ||
| Ottawa West—Nepean | ON | Lib | Lib | 28,378 | 45.6% | 11,502 | 18.5% | 72.6% | 28,378 | 16,876 | 11,646 | – | 3,894 | 839 | 71 | 502 | 62,206 | ||
| Ottawa—Vanier | ON | Lib | Lib | 32,679 | 51.2% | 19,163 | 30.0% | 71.0% | 32,679 | 11,118 | 13,516 | – | 4,796 | 1,064 | 305 | 403 | 63,881 | ||
| Oxford | ON | Con | Con | 29,310 | 48.1% | 17,004 | 27.9% | 66.2% | 11,745 | 29,310 | 12,306 | – | 4,770 | 1,774 | – | 986 | 60,891 | ||
| Parkdale—High Park | ON | Lib | Lib | 28,852 | 47.4% | 9,672 | 15.9% | 74.0% | 28,852 | 8,015 | 19,180 | – | 3,916 | 643 | – | 281 | 60,887 | ||
| Parry Sound-Muskoka | ON | Con | Con | 22,845 | 41.8% | 6,230 | 11.4% | 66.4% | 16,615 | 22,845 | 6,417 | – | 8,409 | – | 377 | – | 54,663 | ||
| Perth Wellington | ON | Con | Con | 25,622 | 46.3% | 10,620 | 19.2% | 67.3% | 15,002 | 25,622 | 8,094 | – | 4,949 | 894 | – | 733 | 55,294 | ||
| Peterborough—Kawartha | ON | Lib | Lib | 27,400 | 39.3% | 3,043 | 4.4% | 70.5% | 27,400 | 24,357 | 11,872 | – | 4,930 | 890 | 180 | 172 | 69,801 | ||
| Pickering—Uxbridge | ON | Lib | Lib | 32,387 | 51.0% | 13,925 | 21.9% | 68.9% | 32,387 | 18,462 | 7,582 | – | 3,799 | 1,265 | – | – | 63,495 | ||
| Renfrew—Nipissing—Pembroke | ON | Con | Con | 31,080 | 52.7% | 19,548 | 33.2% | 69.1% | 11,532 | 31,080 | 8,786 | – | 3,230 | 1,463 | 2,242 | 624 | 58,957 | ||
| Richmond Hill | ON | Lib | Lib | 21,804 | 43.5% | 212 | 0.4% | 59.9% | 21,804 | 21,592 | 4,425 | – | 1,695 | 507 | – | 126 | 50,149 | ||
| Sarnia—Lambton | ON | Con | Con | 28,623 | 49.4% | 15,979 | 27.6% | 68.7% | 12,041 | 28,623 | 12,644 | – | 2,490 | 1,587 | – | 531 | 57,916 | ||
| Sault Ste. Marie | ON | Lib | Lib | 16,284 | 39.1% | 2,877 | 6.9% | 63.5% | 16,284 | 13,407 | 9,459 | – | 1,809 | 741 | – | – | 41,700 | ||
| Scarborough Centre | ON | Lib | Lib | 25,695 | 55.2% | 15,308 | 32.9% | 62.4% | 25,695 | 10,387 | 5,452 | – | 1,336 | 1,162 | 2,524 | – | 46,556 | ||
| Scarborough North | ON | Lib | Lib | 20,911 | 53.4% | 9,073 | 23.2% | 59.7% | 20,911 | 11,838 | 5,039 | – | 796 | 370 | – | 83 | 39,037 | ||
| Scarborough Southwest | ON | Lib | Lib | 28,965 | 57.2% | 18,463 | 36.5% | 65.3% | 28,965 | 10,502 | 7,865 | – | 2,477 | 590 | – | 236 | 50,635 | ||
| Scarborough—Agincourt | ON | Lib | Lib | 21,115 | 50.5% | 5,623 | 13.4% | 59.3% | 21,115 | 15,492 | 3,636 | – | 1,050 | 521 | – | – | 41,814 | ||
| Scarborough-Guildwood | ON | Lib | Lib | 26,123 | 61.1% | 16,570 | 38.8% | 63.9% | 26,123 | 9,553 | 4,806 | – | 1,220 | 648 | 252 | 140 | 42,742 | ||
| Scarborough—Rouge Park | ON | Lib | Lib | 31,360 | 62.2% | 21,245 | 42.1% | 66.4% | 31,360 | 10,115 | 5,801 | – | 2,330 | 467 | – | 353 | 50,426 | ||
| Simcoe North | ON | Con | Con | 27,241 | 43.4% | 7,931 | 12.6% | 65.0% | 19,310 | 27,241 | 8,850 | – | 5,882 | 1,154 | – | 341 | 62,778 | ||
| Simcoe—Grey | ON | Con | Con | 32,812 | 43.5% | 8,887 | 11.8% | 66.0% | 23,925 | 32,812 | 8,462 | – | 8,589 | 1,416 | – | 305 | 75,509 | ||
| Spadina—Fort York | ON | Lib | Lib | 33,822 | 55.8% | 21,634 | 35.7% | 67.7% | 33,822 | 10,680 | 12,188 | – | 3,174 | 672 | 114 | – | 60,650 | ||
| St. Catharines | ON | Lib | Lib | 24,183 | 40.2% | 5,205 | 8.7% | 67.0% | 24,183 | 18,978 | 12,431 | – | 3,695 | 826 | – | – | 60,113 | ||
| Stormont—Dundas—South Glengarry | ON | Con | Con | 28,976 | 53.9% | 15,209 | 28.3% | 64.0% | 13,767 | 28,976 | 7,674 | – | 2,126 | 1,168 | – | – | 53,711 | ||
| Sudbury | ON | Lib | Lib | 19,643 | 40.9% | 5,758 | 12.0% | 65.2% | 19,643 | 9,864 | 13,885 | – | 3,225 | 873 | 205 | 282 | 47,977 | ||
| Thornhill | ON | Con | Con | 29,187 | 54.6% | 10,241 | 19.1% | 63.8% | 18,946 | 29,187 | 3,469 | – | 1,600 | – | – | 294 | 53,496 | ||
| Thunder Bay—Rainy River | ON | Lib | Lib | 14,498 | 35.3% | 2,459 | 6.0% | 63.0% | 14,498 | 12,039 | 11,944 | – | 1,829 | 741 | – | – | 41,051 | ||
| Thunder Bay—Superior North | ON | Lib | Lib | 18,502 | 42.9% | 7,466 | 17.3% | 66.1% | 18,502 | 11,036 | 9,126 | – | 3,639 | 734 | – | 140 | 43,177 | ||
| Timmins-James Bay | ON | NDP | NDP | 14,885 | 40.5% | 4,978 | 13.5% | 58.6% | 9,443 | 9,907 | 14,885 | – | 1,257 | 1,248 | – | – | 36,740 | ||
| Toronto Centre | ON | Lib | Lib | 31,271 | 57.4% | 19,129 | 35.1% | 68.5% | 31,271 | 6,613 | 12,142 | – | 3,852 | – | 126 | 508 | 54,512 | ||
| Toronto—Danforth | ON | Lib | Lib | 27,681 | 47.7% | 8,398 | 14.5% | 71.9% | 27,681 | 6,091 | 19,283 | – | 3,761 | 621 | 210 | 412 | 58,059 | ||
| Toronto—St. Paul's | ON | Lib | Lib | 32,494 | 54.3% | 19,561 | 32.7% | 71.6% | 32,494 | 12,933 | 9,442 | – | 4,042 | 923 | – | – | 59,834 | ||
| University—Rosedale | ON | Lib | Lib | 29,652 | 51.7% | 17,079 | 29.8% | 71.6% | 29,652 | 9,342 | 12,573 | – | 4,861 | 510 | – | 453 | 57,391 | ||
| Vaughan—Woodbridge | ON | Lib | Lib | 25,810 | 51.3% | 7,521 | 14.9% | 63.7% | 25,810 | 18,289 | 3,910 | – | 1,302 | 852 | 165 | – | 50,328 | ||
| Waterloo | ON | Lib | Lib | 31,085 | 48.8% | 15,470 | 24.3% | 74.8% | 31,085 | 15,615 | 9,710 | – | 6,184 | 1,112 | – | – | 63,706 | ||
| Wellington—Halton Hills | ON | Con | Con | 33,044 | 47.4% | 13,267 | 19.0% | 70.8% | 19,777 | 33,044 | 6,499 | – | 8,851 | 1,509 | – | – | 69,680 | ||
| Whitby | ON | Lib | Lib | 30,182 | 43.7% | 5,618 | 8.1% | 70.8% | 30,182 | 24,564 | 9,760 | – | 3,735 | 860 | – | – | 69,101 | ||
| Willowdale | ON | Lib | Lib | 22,282 | 49.0% | 5,830 | 12.8% | 58.2% | 22,282 | 16,452 | 4,231 | – | 1,671 | 563 | – | 271 | 45,470 | ||
| Windsor West | ON | NDP | NDP | 20,800 | 40.0% | 1,922 | 3.7% | 56.0% | 18,878 | 9,925 | 20,800 | – | 1,325 | 958 | – | 76 | 51,962 | ||
| Windsor—Tecumseh | ON | NDP | Lib | 19,046 | 33.4% | 629 | 1.1% | 60.5% | 19,046 | 15,851 | 18,417 | – | 2,177 | 1,279 | – | 187 | 56,957 | ||
| York Centre | ON | Lib | Lib | 21,680 | 50.2% | 5,828 | 13.5% | 62.5% | 21,680 | 15,852 | 4,251 | – | 1,403 | – | – | – | 43,186 | ||
| York South—Weston | ON | Lib | Lib | 25,976 | 58.4% | 17,561 | 39.5% | 57.8% | 25,976 | 8,415 | 7,754 | – | 1,633 | 685 | – | – | 44,463 | ||
| York—Simcoe | ON | Con | Con | 24,918 | 46.3% | 10,511 | 19.5% | 60.7% | 14,407 | 24,918 | 7,620 | – | 4,650 | 875 | – | 1,311 | 53,781 | ||
| Cardigan | PE | Lib | Lib | 10,939 | 49.3% | 4,500 | 20.3% | 75.5% | 10,939 | 6,439 | 1,481 | – | 3,068 | – | – | 240 | 22,167 | ||
| Charlottetown | PE | Lib | Lib | 8,812 | 44.3% | 4,164 | 20.9% | 73.4% | 8,812 | 4,040 | 2,238 | – | 4,648 | – | – | 172 | 19,910 | ||
| Egmont | PE | Lib | Lib | 8,016 | 39.7% | 1,082 | 5.4% | 72.0% | 8,016 | 6,934 | 1,230 | – | 3,998 | – | – | 20,178 | |||
| Malpeque | PE | Lib | Lib | 9,533 | 41.4% | 3,430 | 14.9% | 77.1% | 9,533 | 5,908 | 1,495 | – | 6,103 | – | – | – | 23,039 | ||
| Abitibi—Baie-James—Nunavik—Eeyou | QC | NDP | BQ | 11,432 | 36.1% | 2,469 | 7.8% | 50.2% | 8,963 | 5,240 | 4,104 | 11,432 | 1,151 | 379 | – | 387 | 31,656 | ||
| Abitibi—Témiscamingue | QC | NDP | BQ | 22,803 | 45.5% | 10,386 | 20.7% | 62.2% | 12,417 | 7,537 | 5,093 | 22,803 | 1,818 | 487 | – | – | 50,155 | ||
| Ahuntsic-Cartierville | QC | Lib | Lib | 28,904 | 52.4% | 16,930 | 30.7% | 67.5% | 28,904 | 4,013 | 6,284 | 11,974 | 3,352 | 584 | – | – | 55,111 | ||
| Alfred-Pellan | QC | Lib | Lib | 26,015 | 47.9% | 10,466 | 19.3% | 69.9% | 26,015 | 5,917 | 4,109 | 15,549 | 1,958 | 471 | 113 | 177 | 54,309 | ||
| Argenteuil—La Petite-Nation | QC | Lib | Lib | 18,896 | 37.8% | 729 | 1.5% | 63.4% | 18,896 | 6,044 | 3,758 | 18,167 | 2,411 | 721 | – | – | 49,997 | ||
| Avignon—La Mitis—Matane—Matapédia | QC | Lib | BQ | 18,500 | 51.4% | 6,312 | 17.5% | 61.4% | 12,188 | 2,756 | 1,435 | 18,500 | 699 | 210 | – | 180 | 35,968 | ||
| Beauce | QC | Con | Con | 22,860 | 38.5% | 6,064 | 10.2% | 70.2% | 6,971 | 22,860 | 1,847 | 8,410 | 1,461 | 16,796 | – | 1,084 | 59,429 | ||
| Beauport—Côte-de-Beaupré—Île d’Orléans—Charlevoix | QC | Con | BQ | 18,407 | 36.4% | 3,363 | 6.6% | 67.5% | 10,608 | 15,044 | 2,841 | 18,407 | 1,355 | 1,045 | 1,335 | – | 50,635 | ||
| Beauport—Limoilou | QC | Con | BQ | 15,149 | 30.2% | 1,964 | 3.9% | 66.1% | 13,020 | 13,185 | 5,599 | 15,149 | 2,127 | 1,033 | – | 78 | 50,191 | ||
| Bécancour—Nicolet—Saurel | QC | BQ | BQ | 29,653 | 56.7% | 20,321 | 38.8% | 67.4% | 9,332 | 8,434 | 2,732 | 29,653 | 1,697 | 489 | – | – | 52,337 | ||
| Bellechasse—Les Etchemins—Lévis | QC | Con | Con | 32,283 | 50.1% | 17,529 | 27.2% | 69.6% | 10,734 | 32,283 | 3,256 | 14,754 | 1,925 | 1,307 | – | 188 | 64,447 | ||
| Beloeil—Chambly | QC | NDP | BQ | 35,068 | 50.5% | 19,009 | 27.4% | 73.7% | 16,059 | 4,305 | 10,086 | 35,068 | 3,255 | 512 | – | 205 | 69,490 | ||
| Berthier—Maskinongé | QC | NDP | BQ | 21,200 | 37.6% | 1,502 | 2.7% | 68.0% | 7,796 | 5,812 | 19,698 | 21,200 | 1,008 | 428 | 154 | 261 | 56,354 | ||
| Bourassa | QC | Lib | Lib | 23,231 | 57.6% | 14,188 | 35.2% | 59.1% | 23,231 | 2,899 | 3,204 | 9,043 | 1,343 | 347 | 212 | 72 | 40,351 | ||
| Brome—Missisquoi | QC | Lib | Lib | 23,450 | 38.2% | 2,298 | 3.7% | 70.1% | 23,450 | 7,697 | 4,887 | 21,152 | 3,302 | 456 | – | 497 | 61,441 | ||
| Brossard—Saint-Lambert | QC | Lib | Lib | 30,537 | 53.9% | 19,406 | 34.3% | 68.7% | 30,537 | 6,112 | 5,410 | 11,131 | 2,935 | 527 | – | – | 56,652 | ||
| Charlesbourg—Haute-Saint-Charles | QC | Con | Con | 22,484 | 38.0% | 6,431 | 10.8% | 70.3% | 12,584 | 22,484 | 4,554 | 16,053 | 2,042 | 1,379 | – | – | 59,096 | ||
| Châteauguay—Lacolle | QC | Lib | Lib | 20,118 | 38.4% | 639 | 1.2% | 68.4% | 20,118 | 5,851 | 4,005 | 19,479 | 1,929 | 563 | – | 457 | 52,402 | ||
| Chicoutimi—Le Fjord | QC | Lib | Con | 16,155 | 36.8% | 834 | 1.9% | 68.3% | 7,504 | 16,155 | 2,855 | 15,321 | 1,388 | 359 | – | 299 | 43,881 | ||
| Compton—Stanstead | QC | Lib | Lib | 21,731 | 37.3% | 3,160 | 5.4% | 70.2% | 21,731 | 8,446 | 5,607 | 18,571 | 3,044 | 586 | – | 252 | 58,237 | ||
| Dorval—Lachine—LaSalle | QC | Lib | Lib | 27,821 | 52.9% | 18,847 | 35.8% | 62.5% | 27,821 | 5,543 | 6,207 | 8,974 | 2,898 | 528 | – | 603 | 52,574 | ||
| Drummond | QC | NDP | BQ | 24,574 | 44.8% | 15,022 | 27.4% | 66.7% | 9,552 | 9,083 | 8,716 | 24,574 | 1,856 | 525 | – | 518 | 54,824 | ||
| Gaspésie—Les Îles-de-la-Madeleine | QC | Lib | Lib | 16,296 | 42.5% | 637 | 1.7% | 60.5% | 16,296 | 3,022 | 1,722 | 15,659 | 1,130 | 198 | – | 353 | 38,380 | ||
| Gatineau | QC | Lib | Lib | 29,084 | 52.1% | 17,158 | 30.8% | 67.0% | 29,084 | 5,745 | 6,128 | 11,926 | 2,264 | 560 | – | 76 | 55,783 | ||
| Hochelaga | QC | NDP | Lib | 18,008 | 34.0% | 328 | 0.6% | 65.4% | 18,008 | 2,381 | 11,451 | 17,680 | 2,618 | 377 | – | 522 | 53,037 | ||
| Honoré-Mercier | QC | Lib | Lib | 29,543 | 58.7% | 19,564 | 38.8% | 65.4% | 29,543 | 4,808 | 4,130 | 9,979 | 1,373 | 459 | – | 71 | 50,363 | ||
| Hull—Aylmer | QC | Lib | Lib | 29,732 | 54.1% | 21,721 | 39.5% | 70.4% | 29,732 | 4,979 | 7,467 | 8,011 | 3,869 | 638 | – | 297 | 54,993 | ||
| Joliette | QC | BQ | BQ | 33,590 | 58.2% | 20,595 | 35.7% | 66.3% | 12,995 | 5,176 | 2,623 | 33,590 | 2,343 | 498 | – | 474 | 57,699 | ||
| Jonquière | QC | NDP | BQ | 17,577 | 35.6% | 5,436 | 11.0% | 69.3% | 7,849 | 10,338 | 12,141 | 17,577 | 1,009 | 453 | – | – | 49,367 | ||
| La Pointe-de-l'Île | QC | BQ | BQ | 26,010 | 46.8% | 9,112 | 16.4% | 66.2% | 16,898 | 3,984 | 6,057 | 26,010 | 1,910 | 388 | – | 287 | 55,534 | ||
| La Prairie | QC | Lib | BQ | 25,707 | 41.8% | 3,203 | 5.2% | 72.0% | 22,504 | 5,540 | 4,744 | 25,707 | 2,565 | 393 | – | 100 | 61,553 | ||
| Lac-Saint-Jean | QC | Con | BQ | 23,839 | 44.0% | 10,206 | 18.8% | 65.6% | 13,633 | 12,544 | 2,753 | 23,839 | 1,010 | 448 | – | – | 54,227 | ||
| Lac-Saint-Louis | QC | Lib | Lib | 34,622 | 58.2% | 25,539 | 42.9% | 71.6% | 34,622 | 9,083 | 7,263 | 3,169 | 4,176 | 805 | – | 407 | 59,525 | ||
| LaSalle—Émard—Verdun | QC | Lib | Lib | 22,803 | 43.5% | 10,184 | 19.4% | 64.7% | 22,803 | 3,690 | 8,628 | 12,619 | 3,583 | 490 | 274 | 304 | 52,391 | ||
| Laurentides—Labelle | QC | Lib | BQ | 30,625 | 46.8% | 8,970 | 13.7% | 66.2% | 21,655 | 4,983 | 4,122 | 30,625 | 3,157 | 418 | 174 | 272 | 65,406 | ||
| Laurier—Sainte-Marie | QC | NDP | Lib | 22,306 | 41.8% | 8,853 | 16.6% | 65.4% | 22,306 | 1,502 | 13,453 | 12,188 | 3,225 | 320 | 42 | 373 | 53,409 | ||
| Laval—Les Îles | QC | Lib | Lib | 26,031 | 48.2% | 14,911 | 27.6% | 65.8% | 26,031 | 8,816 | 4,803 | 11,120 | 2,306 | 885 | – | – | 53,961 | ||
| Lévis—Lotbinière | QC | Con | Con | 28,297 | 44.6% | 12,376 | 19.5% | 72.4% | 10,761 | 28,297 | 4,355 | 15,921 | 1,908 | 2,247 | – | – | 63,489 | ||
| Longueuil—Charles-LeMoyne | QC | Lib | Lib | 20,114 | 39.0% | 1,320 | 2.6% | 62.8% | 20,114 | 3,811 | 5,289 | 18,794 | 2,978 | 558 | – | – | 51,544 | ||
| Longueuil—Saint-Hubert | QC | NDP | BQ | 23,061 | 38.5% | 2,590 | 4.3% | 69.9% | 20,471 | 3,779 | 5,104 | 23,061 | 6,745 | 467 | 217 | – | 59,844 | ||
| Louis-Hébert | QC | Lib | Lib | 25,140 | 40.5% | 7,765 | 12.5% | 76.6% | 25,140 | 10,912 | 4,884 | 17,375 | 2,466 | 1,016 | 267 | – | 62,060 | ||
| Louis-Saint-Laurent | QC | Con | Con | 29,279 | 44.7% | 14,605 | 22.3% | 70.7% | 13,571 | 29,279 | 4,339 | 14,674 | 2,155 | 1,543 | – | – | 65,561 | ||
| Manicouagan | QC | BQ | BQ | 21,768 | 53.9% | 13,975 | 34.6% | 53.8% | 7,793 | 7,771 | 1,482 | 21,768 | 1,293 | 283 | – | – | 40,390 | ||
| Marc-Aurèle-Fortin | QC | Lib | Lib | 24,865 | 44.5% | 6,796 | 12.2% | 72.4% | 24,865 | 5,423 | 4,741 | 18,069 | 2,111 | 465 | 143 | – | 55,817 | ||
| Mégantic—L'Érable | QC | Con | Con | 23,392 | 49.2% | 11,143 | 23.5% | 68.5% | 7,388 | 23,392 | 1,936 | 12,249 | 1,258 | 812 | 217 | 256 | 47,508 | ||
| Mirabel | QC | BQ | BQ | 33,219 | 51.1% | 17,057 | 26.2% | 68.7% | 16,162 | 5,940 | 5,219 | 33,219 | 3,517 | 641 | – | 332 | 65,030 | ||
| Montarville | QC | Lib | BQ | 25,366 | 42.8% | 4,305 | 7.3% | 77.8% | 21,061 | 4,138 | 4,984 | 25,366 | 2,967 | 501 | – | 211 | 59,228 | ||
| Montcalm | QC | BQ | BQ | 31,791 | 58.0% | 20,591 | 37.6% | 63.4% | 11,200 | 4,942 | 3,514 | 31,791 | 2,416 | 524 | – | 419 | 54,806 | ||
| Montmagny—L'Islet—Kamouraska—Rivière-du-Loup | QC | Con | Con | 20,989 | 41.7% | 4,728 | 9.4% | 65.7% | 8,210 | 20,989 | 3,481 | 16,261 | 1,030 | 417 | – | – | 50,388 | ||
| Mount Royal | QC | Lib | Lib | 24,590 | 56.3% | 13,703 | 31.4% | 60.5% | 24,590 | 10,887 | 3,609 | 1,757 | 2,389 | 362 | – | 85 | 43,679 | ||
| Notre-Dame-de-Grâce—Westmount | QC | Lib | Lib | 28,323 | 56.3% | 20,570 | 40.9% | 66.4% | 28,323 | 5,759 | 7,753 | 2,359 | 5,397 | 565 | 98 | 67 | 50,321 | ||
| Outremont | QC | NDP | Lib | 19,148 | 46.2% | 10,829 | 26.1% | 62.2% | 19,148 | 2,707 | 8,319 | 5,741 | 5,018 | 369 | – | 155 | 41,457 | ||
| Papineau | QC | Lib | Lib | 25,957 | 51.1% | 16,209 | 31.9% | 65.5% | 25,957 | 2,155 | 9,748 | 8,124 | 3,741 | 322 | 185 | 549 | 50,781 | ||
| Pierre-Boucher—Les Patriotes—Verchères | QC | BQ | BQ | 31,009 | 51.0% | 13,676 | 22.5% | 76.3% | 17,333 | 4,910 | 4,192 | 31,009 | 2,955 | 384 | – | – | 60,783 | ||
| Pierrefonds—Dollard | QC | Lib | Lib | 31,305 | 56.4% | 21,508 | 38.8% | 67.4% | 31,305 | 9,797 | 5,687 | 4,469 | 2,866 | 711 | 636 | – | 55,471 | ||
| Pontiac | QC | Lib | Lib | 30,217 | 48.9% | 19,801 | 32.0% | 68.2% | 30,217 | 10,416 | 6,503 | 9,929 | 3,762 | 775 | – | 245 | 61,847 | ||
| Portneuf—Jacques-Cartier | QC | Con | Con | 28,110 | 43.5% | 12,403 | 19.2% | 70.9% | 12,876 | 28,110 | 3,758 | 15,707 | 2,308 | 1,915 | – | – | 64,674 | ||
| Québec | QC | Lib | Lib | 18,047 | 33.3% | 325 | 0.6% | 70.0% | 18,047 | 8,118 | 6,220 | 17,722 | 2,949 | 674 | – | 468 | 54,198 | ||
| Repentigny | QC | BQ | BQ | 34,837 | 53.2% | 16,726 | 25.6% | 72.2% | 18,111 | 4,878 | 4,470 | 34,837 | 2,289 | 524 | – | 347 | 65,456 | ||
| Richmond—Arthabaska | QC | Con | Con | 26,553 | 45.3% | 10,014 | 17.1% | 68.8% | 8,868 | 26,553 | 2,864 | 16,539 | 3,133 | 681 | – | – | 58,638 | ||
| Rimouski-Neigette—Témiscouata—Les Basques | QC | NDP | BQ | 17,314 | 37.8% | 4,264 | 9.3% | 66.5% | 10,095 | 4,073 | 13,050 | 17,314 | 824 | 232 | – | 179 | 45,767 | ||
| Rivière-des-Mille-Îles | QC | Lib | BQ | 23,629 | 40.6% | 2,620 | 4.5% | 72.1% | 21,009 | 4,684 | 5,002 | 23,629 | 3,015 | 845 | – | – | 58,184 | ||
| Rivière-du-Nord | QC | BQ | BQ | 31,281 | 52.0% | 17,879 | 29.7% | 64.0% | 13,402 | 7,120 | 4,194 | 31,281 | 3,345 | 407 | 127 | 225 | 60,101 | ||
| Rosemont—La Petite-Patrie | QC | NDP | NDP | 25,575 | 42.5% | 10,999 | 18.3% | 71.4% | 14,576 | 1,405 | 25,575 | 14,306 | 3,539 | 293 | – | 512 | 60,206 | ||
| Saint-Hyacinthe—Bagot | QC | NDP | BQ | 23,143 | 41.4% | 11,240 | 20.1% | 70.1% | 11,903 | 8,062 | 10,297 | 23,143 | 2,031 | 478 | – | – | 55,914 | ||
| Saint-Jean | QC | Lib | BQ | 27,750 | 44.8% | 8,844 | 14.3% | 69.3% | 18,906 | 6,612 | 4,794 | 27,750 | 3,127 | 397 | – | 289 | 61,875 | ||
| Saint-Laurent | QC | Lib | Lib | 23,527 | 58.6% | 16,522 | 41.2% | 60.0% | 23,527 | 7,005 | 4,065 | 2,845 | 2,150 | 484 | – | 71 | 40,147 | ||
| Saint-Léonard—Saint-Michel | QC | Lib | Lib | 27,866 | 61.3% | 22,443 | 49.4% | 60.4% | 27,866 | 5,423 | 2,964 | 4,351 | 1,183 | 501 | 3,061 | 85 | 45,434 | ||
| Saint-Maurice—Champlain | QC | Lib | Lib | 23,104 | 39.6% | 3,154 | 5.4% | 65.2% | 23,104 | 9,542 | 3,071 | 19,950 | 1,809 | 938 | – | – | 58,414 | ||
| Salaberry—Suroît | QC | NDP | BQ | 29,975 | 47.7% | 11,293 | 18.0% | 67.0% | 18,682 | 6,116 | 5,024 | 29,975 | 1,997 | 767 | – | 342 | 62,903 | ||
| Shefford | QC | Lib | BQ | 23,503 | 38.6% | 898 | 1.5% | 68.4% | 22,605 | 7,495 | 3,705 | 23,503 | 2,814 | 497 | – | 294 | 60,913 | ||
| Sherbrooke | QC | NDP | Lib | 17,490 | 29.3% | 609 | 1.0% | 68.3% | 17,490 | 6,362 | 16,881 | 15,470 | 2,716 | – | 588 | 219 | 59,726 | ||
| Terrebonne | QC | BQ | BQ | 31,029 | 50.6% | 13,035 | 21.3% | 70.5% | 17,944 | 4,640 | 4,627 | 31,029 | 2,277 | 399 | 159 | 260 | 61,335 | ||
| Thérèse-De Blainville | QC | Lib | BQ | 24,486 | 41.8% | 3,498 | 6.0% | 72.1% | 20,988 | 5,264 | 4,431 | 24,486 | 2,710 | 366 | 89 | 215 | 58,549 | ||
| Trois-Rivières | QC | NDP | BQ | 17,240 | 28.5% | 1,466 | 2.4% | 66.7% | 15,774 | 15,240 | 10,090 | 17,240 | 1,492 | 565 | 137 | – | 60,538 | ||
| Vaudreuil—Soulanges | QC | Lib | Lib | 32,254 | 47.3% | 15,654 | 23.0% | 72.4% | 32,254 | 7,804 | 7,368 | 16,600 | 3,405 | 711 | – | – | 68,142 | ||
| Ville-Marie—Le Sud-Ouest—Île-des-Sœurs | QC | Lib | Lib | 28,087 | 53.5% | 19,813 | 37.7% | 60.3% | 28,087 | 4,609 | 8,274 | 6,899 | 3,718 | 520 | 230 | 185 | 52,522 | ||
| Vimy | QC | Lib | Lib | 26,490 | 47.7% | 11,035 | 19.9% | 64.3% | 26,490 | 5,951 | 4,779 | 15,455 | 2,125 | 733 | – | – | 55,533 | ||
| Battlefords—Lloydminster | SK | Con | Con | 28,030 | 78.3% | 23,932 | 66.8% | 70.7% | 2,426 | 28,030 | 4,098 | – | 605 | 662 | – | – | 35,821 | ||
| Carlton Trail—Eagle Creek | SK | Con | Con | 35,313 | 78.6% | 29,778 | 66.2% | 78.5% | 2,085 | 35,313 | 5,535 | – | 873 | 799 | 344 | – | 44,949 | ||
| Cypress Hills—Grasslands | SK | Con | Con | 31,140 | 81.1% | 27,474 | 71.5% | 77.2% | 1,595 | 31,140 | 3,666 | – | 719 | 1,075 | 220 | – | 38,415 | ||
| Desnethé—Missinippi—Churchill River | SK | NDP | Con | 11,531 | 42.3% | 3,790 | 13.9% | 59.8% | 7,225 | 11,531 | 7,741 | – | 543 | 217 | – | – | 27,257 | ||
| Moose Jaw—Lake Centre—Lanigan | SK | Con | Con | 31,993 | 71.1% | 24,333 | 54.1% | 76.9% | 2,517 | 31,993 | 7,660 | – | 1,201 | 1,613 | – | – | 44,984 | ||
| Prince Albert | SK | Con | Con | 26,891 | 67.7% | 19,996 | 50.3% | 69.8% | 4,107 | 26,891 | 6,925 | – | 839 | 778 | 170 | 39,710 | |||
| Regina—Lewvan | SK | NDP | Con | 27,088 | 52.5% | 12,321 | 23.9% | 75.9% | 6,826 | 27,088 | 14,767 | – | 2,099 | 573 | 201 | 60 | 51,614 | ||
| Regina—Qu'Appelle | SK | Con | Con | 24,463 | 63.1% | 16,778 | 43.3% | 70.7% | 4,543 | 24,463 | 7,685 | – | 1,282 | 513 | 78 | 191 | 38,755 | ||
| Regina—Wascana | SK | Lib | Con | 22,418 | 49.4% | 7,176 | 15.8% | 76.3% | 15,242 | 22,418 | 5,801 | – | 1,316 | 450 | 128 | – | 45,355 | ||
| Saskatoon West | SK | Con | Con | 18,597 | 47.7% | 2,889 | 7.4% | 64.7% | 2,863 | 18,597 | 15,708 | – | 1,042 | 775 | – | – | 38,985 | ||
| Saskatoon—Grasswood | SK | Con | Con | 26,336 | 53.3% | 13,664 | 27.6% | 77.6% | 8,419 | 26,336 | 12,672 | – | 1,320 | 692 | – | – | 49,439 | ||
| Saskatoon—University | SK | NDP | Con | 24,514 | 52.1% | 10,520 | 22.4% | 77.3% | 6,146 | 24,514 | 13,994 | – | 1,401 | 667 | – | 305 | 47,027 | ||
| Souris—Moose Mountain | SK | Con | Con | 35,067 | 84.4% | 31,853 | 76.7% | 80.2% | 1,718 | 35,067 | 3,214 | – | 681 | 702 | – | 168 | 41,550 | ||
| Yorkton—Melville | SK | Con | Con | 29,523 | 76.2% | 24,776 | 63.9% | 74.0% | 2,488 | 29,523 | 4,747 | – | 1,070 | 941 | 38,769 | ||||
| Northwest Territories | Terr | Lib | Lib | 6,467 | 39.7% | 2,310 | 14.2% | 54.3% | 6,467 | 4,157 | 3,640 | – | 1,731 | 296 | – | – | 16,291 | ||
| Nunavut | Terr | Lib | NDP | 3,861 | 40.8% | 943 | 10.0% | 51.1% | 2,918 | 2,469 | 3,861 | – | 206 | – | – | – | 9,454 | ||
| Yukon | Terr | Lib | Lib | 7,034 | 33.5% | 153 | 0.7% | 73.2% | 7,034 | 6,881 | 4,617 | – | 2,201 | 284 | – | – | 21,017 | ||
- ^ "October 21, 2019 Federal Election: Election Results by Electoral District". elections.ca. Retrieved November 4, 2019.
- ^ including spoilt ballots
- ^ minor political parties receiving less than 1% of the national popular vote are aggregated under "Other"; independent candidates are aggregated separately
Results overview[edit]
Summary analysis[edit]
| ↓ | |||||||||
| 157 | 121 | 32 | 24 | 3 | 1 | ||||
| Liberal | Conservative | BQ | NDP | G | I | ||||
| Party | Votes | Seats | ||||
|---|---|---|---|---|---|---|
| Liberal | 6,018,728 | 33.1% |
157 / 338 (46%)
|
|||
| Conservative | 6,239,227 | 34.3% |
121 / 338 (36%)
|
|||
| Bloc Québécois | 1,384,030 | 7.6% |
32 / 338 (9%)
|
|||
| New Democratic | 2,903,722 | 16.0% |
24 / 338 (7%)
|
|||
| Green | 1,189,607 | 6.5% |
3 / 338 (0.9%)
|
|||
| Independent | 75,836 | 0.4% |
1 / 338 (0.3%)
|
|||
Seats, of total, by party
Votes, of total, by party

Change in popular vote[edit]
| Party | 2019 | 2015 | Change (pp) | ||
|---|---|---|---|---|---|
| █ Liberal | 33.12% |
39.47% |
-6.35 | ||
| █ Conservative | 34.34% |
31.91% |
2.43 | ||
| █ Bloc Québécois | 7.63% |
4.67% |
2.96 | ||
| █ New Democratic | 15.98% |
19.73% |
-3.75 | ||
| █ Green | 6.55% |
3.43% |
3.12 | ||
| █ People's | 1.64% |
New | 1.64 | ||
| █ Other | 0.67% |
0.79% |
-0.12 | ||
Results by province[edit]
| Party name | BC | AB | SK | MB | ON | QC | NB | NS | PE | NL | YT | NT | NU | Total | ||
|---|---|---|---|---|---|---|---|---|---|---|---|---|---|---|---|---|
| Liberal | Seats: | 11 | – | – | 4 | 79 | 35 | 6 | 10 | 4 | 6 | 1 | 1 | – | 157 | |
| Vote: | 26.2 | 13.8 | 11.7 | 26.5 | 41.6 | 34.3 | 37.5 | 41.4 | 43.7 | 44.9 | 33.5 | 39.7 | 30.9 | 33.1 | ||
| Conservative | Seats: | 17 | 33 | 14 | 7 | 36 | 10 | 3 | 1 | – | – | – | – | – | 121 | |
| Vote: | 34.0 | 69.0 | 64.0 | 45.2 | 33.1 | 16.0 | 32.8 | 25.7 | 27.3 | 27.9 | 32.7 | 25.5 | 26.1 | 34.3 | ||
| NDP | Seats: | 11 | 1 | – | 3 | 6 | 1 | – | – | – | 1 | – | – | 1 | 24 | |
| Vote: | 24.4 | 11.6 | 19.6 | 20.8 | 16.8 | 10.8 | 9.4 | 18.9 | 7.6 | 23.7 | 22.0 | 22.3 | 40.8 | 16.0 | ||
| Bloc Québécois | Seats: | 32 | 32 | |||||||||||||
| Vote: | 32.4 | 7.6 | ||||||||||||||
| Green | Seats: | 2 | – | – | – | – | – | 1 | – | – | – | – | – | – | 3 | |
| Vote: | 12.5 | 2.8 | 2.6 | 5.1 | 6.2 | 4.5 | 17.2 | 11.0 | 20.9 | 3.1 | 10.5 | 10.6 | 2.2 | 6.5 | ||
| People's | Seats: | – | – | – | – | – | – | – | – | – | – | – | – | – | – | |
| Vote: | 1.7 | 2.2 | 1.8 | 1.7 | 1.6 | 1.5 | 2.0 | 1.2 | – | 0.1 | 1.4 | 1.8 | – | 1.6 | ||
| Independents and others | Seats: | 1 | – | – | – | – | – | – | – | – | – | – | – | – | 1 | |
| Vote: | 0.9 | 0.8 | 0.2 | 0.6 | 0.2 | 0.1 | 0.1 | 0.3 | – | – | – | – | – | 0.2 | ||
| Seats: | 42 | 34 | 14 | 14 | 121 | 78 | 10 | 11 | 4 | 7 | 1 | 1 | 1 | 338 | ||
| Province | Liberal | Conservative | NDP | Bloc | Green |
|---|---|---|---|---|---|
| Ontario | 79 / 121
|
36 / 121
|
6 / 121
|
— | 0 / 121
|
| Quebec | 35 / 78
|
10 / 78
|
1 / 78
|
32 / 78
|
0 / 78
|
| Nova Scotia | 10 / 11
|
1 / 11
|
0 / 11
|
— | 0 / 11
|
| New Brunswick | 6 / 10
|
3 / 10
|
0 / 10
|
— | 1 / 10
|
| Manitoba | 4 / 14
|
7 / 14
|
3 / 14
|
— | 0 / 14
|
| British Columbia | 11 / 42
|
17 / 42
|
11 / 42
|
— | 2 / 42
|
| Prince Edward Island | 4 / 4
|
0 / 4
|
0 / 4
|
— | 0 / 4
|
| Saskatchewan | 0 / 14
|
14 / 14
|
0 / 14
|
— | 0 / 14
|
| Alberta | 0 / 34
|
33 / 34
|
1 / 34
|
— | 0 / 34
|
| Newfoundland and Labrador | 6 / 7
|
0 / 7
|
1 / 7
|
— | 0 / 7
|
| Northern Canada | 2 / 3
|
0 / 3
|
1 / 3
|
— | 0 / 3
|
| Total | 157 / 338
|
121 / 338
|
24 / 338
|
32 / 338
|
3 / 338
|
Seats won and lost by party[edit]
| Party | 2015 | Gain from (loss to) | 2019 | |||||||||
|---|---|---|---|---|---|---|---|---|---|---|---|---|
| Lib | Con | NDP | BQ | Grn | Ind | |||||||
| Liberal | 184 | 2 | (21) | 5 | (3) | (8) | (1) | (1) | 157 | |||
| Conservative | 99 | 21 | (2) | 6 | (3) | 121 | ||||||
| New Democratic | 44 | 3 | (5) | (6) | (11) | (1) | 24 | |||||
| Bloc Québécois | 10 | 8 | 3 | 11 | 32 | |||||||
| Green | 1 | 1 | 1 | 3 | ||||||||
| Independent | – | 1 | 1 | |||||||||
| Total | 338 | 34 | (7) | 5 | (27) | 23 | (3) | (22) | (2) | (1) | 338 | |
The following 62 seats (representing 18.34 percent of seats in the House of Commons) changed allegiance from the 2015 election:
- ^ Leona Alleslev had previously crossed the floor from the Liberals in 2018
The reasons for the changes were:
| Reason | # of MPs |
|---|---|
| Defeated in general election | 45 |
| Open seats that changed hands | 11 |
| Vacancies previously filled in byelections; subsequently retained | 3 |
| Vacancies previously filled in byelections; subsequently lost to another party | 1 |
| Standing under different political affiliation | 2 |
| Total | 62 |
Defeated MPs[edit]
- ^ previously served as MP in 2008-2015
- ^ previously served as MP in 2004-2015
- ^ previously served as MP in 2011-2015
- ^ previously served as MP in 2008-2015
- ^ previously served as Alliance MP in 2000-2004
- ^ expelled from NDP caucus in 2019; stood as a Green candidate in general election
- ^ previously served as MP in 2006-2011
Open seats that changed hands[edit]
Of the 44 seats that were open at dissolution, 11 were won by candidates of non-incumbent parties:
| Party (2015) | Electoral district | Outgoing MP | Won by | Party |
|---|---|---|---|---|
| █ Liberal | Calgary Skyview | Darshan Kang | Jag Sahota | █ Conservative |
| █ Liberal | Nunavut | Hunter Tootoo | Mumilaaq Qaqqaq | █ New Democratic |
| █ Liberal | Tobique—Mactaquac | T. J. Harvey | Richard Bragdon | █ Conservative |
| █ Liberal | West Nova | Colin Fraser | Chris d'Entremont | █ Conservative |
| █ New Democratic | Abitibi—Baie-James—Nunavik—Eeyou | Romeo Saganash | Sylvie Bérubé | █ Bloc Québécois |
| █ New Democratic | Abitibi—Témiscamingue | Christine Moore | Sébastien Lemire | █ Bloc Québécois |
| █ New Democratic | Hochelaga | Marjolaine Boutin-Sweet | Soraya Martinez Ferrada | █ Liberal |
| █ New Democratic | Laurier—Sainte-Marie | Hélène Laverdière | Steven Guilbeault | █ Liberal |
| █ New Democratic | Port Moody—Coquitlam | Fin Donnelly | Nelly Shin | █ Conservative |
| █ New Democratic | Regina—Lewvan | Erin Weir | Warren Steinley | █ Conservative |
| █ New Democratic | Salaberry—Suroît | Anne Minh-Thu Quach | Claude DeBellefeuille | █ Bloc Québécois |
Vacancies filled in earlier byelections[edit]
Three open seats were filled in earlier byelections, retained by the winners in the ensuing general election:
| Party (2015) | Electoral district | Outgoing MP | Won by | Party |
|---|---|---|---|---|
| █ Liberal | Chicoutimi—Le Fjord | Denis Lemieux | Richard Martel (2018) | █ Conservative |
| █ New Democratic | Nanaimo—Ladysmith | Sheila Malcolmson | Paul Manly (2019) | █ Green |
| █ New Democratic | Outremont | Tom Mulcair | Rachel Bendayan (2019) | █ Liberal |
Two vacancies were filled in earlier byelections, but the winners failed to keep them in the general election. They were both upset votes in favour of the Liberals, where one subsequently returned to the previous party, while the other went to a third party.
| Party (2015) | Electoral district | Outgoing MP | Won by | Party | Ousted by | Party |
|---|---|---|---|---|---|---|
| █ Conservative | Lac-Saint-Jean | Denis Lebel | Richard Hébert (2017) | █ Liberal | Alexis Brunelle-Duceppe | █ Bloc Québécois |
| █ Conservative | South Surrey—White Rock | Dianne Watts | Gordie Hogg (2017) | █ Liberal | Kerry-Lynne Findlay | █ Conservative |
MPs standing under a different political affiliation[edit]
Leona Alleslev had previously crossed the floor from the Liberals to the Conservatives in 2018, and was subsequently re-elected as a Conservative. Jody Wilson-Raybould contested her seat as an Independent and won, after having been expelled from the Liberal caucus.
| MP | Riding | 2015 | 2019 |
|---|---|---|---|
| Leona Alleslev | Aurora—Oak Ridges—Richmond Hill | █ Liberal | █ Conservative |
| Jody Wilson-Raybould | Vancouver Granville | █ Liberal | █ Independent |
Swing analysis within the largest provinces[edit]
| Party | Seats | Votes | ||||||
|---|---|---|---|---|---|---|---|---|
| 2015 | Gained | Lost | 2019 | Total | % | Change (%) | ||
| Conservative | 10 | 7 | – | 17 | 799,239 | 34.1 | +4.1 | |
| Liberal | 17 | – | -6 | 11 | 612,098 | 26.1 | -9.1 | |
| New Democratic | 14 | – | -3 | 11 | 572,063 | 24.4 | -1.5 | |
| Green | 1 | 1 | – | 2 | 290,629 | 12.4 | +4.2 | |
| People's | – | – | – | – | 39,549 | 1.7 | New | |
| Independent and other | – | 1 | – | 1 | 30,182 | 1.3 | +0.6 | |
| Total | 42 | 2,343,760 | Turnout | 65.0% | ||||
| Liberal to Conservative swing | 6.6% | |||||||
| Liberal to Green swing | 6.6% | |||||||
| Party | Seats | Votes | ||||||
|---|---|---|---|---|---|---|---|---|
| 2015 | Gained | Lost | 2019 | Total | % | Change (%) | ||
| Conservative | 29 | 4 | – | 33 | 1,413,360 | 69.2 | +9.7 | |
| Liberal | 4 | – | -4 | – | 280,309 | 13.7 | -10.9 | |
| New Democratic | 1 | – | – | 1 | 235,013 | 11.5 | -0.1 | |
| Green | – | – | – | – | 57,468 | 2.8 | +0.3 | |
| Independent and other | – | – | – | – | 9,476 | 0.6 | -1.2 | |
| Total | 34 | 2,041,445 | Turnout | 68.5% | ||||
| Liberal to Conservative swing | 10.3% | |||||||
| Party | Seats | Votes | ||||||
|---|---|---|---|---|---|---|---|---|
| 2015 | Gained | Lost | 2019 | Total | % | Change (%) | ||
| Conservative | 10 | 4 | – | 14 | 366,611 | 64.3 | +15.8 | |
| New Democratic | 3 | – | -3 | – | 111,379 | 19.5 | -5.6 | |
| Liberal | 1 | – | -1 | – | 66,031 | 11.6 | -12.3 | |
| Green | – | – | – | – | 14,417 | 2.5 | +0.4 | |
| People's | – | – | – | – | 10,211 | 1.8 | New | |
| Independent and other | – | – | – | – | 1,856 | 0.3 | -0.1 | |
| Total | 14 | 570,505 | Turnout | 71.7% | ||||
| Liberal to Conservative swing | 14.0% | |||||||
| Party | Seats | Votes | ||||||
|---|---|---|---|---|---|---|---|---|
| 2015 | Gained | Lost | 2019 | Total | % | Change (%) | ||
| Conservative | 5 | 2 | – | 7 | 264,071 | 45.4 | +8.1 | |
| Liberal | 7 | – | -3 | 4 | 152,803 | 26.3 | -18.3 | |
| New Democratic | 2 | 1 | – | 3 | 120,533 | 20.7 | +6.9 | |
| Green | – | – | – | – | 29,768 | 5.1 | +1.9 | |
| People's | – | – | – | – | 10,021 | 1.7 | New | |
| Independent and other | – | – | – | – | 3,840 | 0.8 | -0.3 | |
| Total | 14 | 581,036 | Turnout | 63.8% | ||||
| Liberal to Conservative swing | 13.2% | |||||||
| Party | Seats | Votes | ||||||
|---|---|---|---|---|---|---|---|---|
| 2015 | Gained | Lost | 2019 | Total | % | Change (%) | ||
| Liberal | 80 | 2 | -3 | 79 | 2,814,010 | 41.5 | -3.3 | |
| Conservative | 33 | 3 | – | 36 | 2,252,238 | 33.2 | -1.8 | |
| New Democratic | 8 | – | -2 | 6 | 1,138,735 | 16.8 | +0.2 | |
| Green | – | – | – | – | 420,397 | 6.2 | +3.3 | |
| People's | – | – | – | – | 107,673 | 1.6 | New | |
| Independent and other | – | – | – | – | 53,989 | 0.7 | – | |
| Total | 121 | 6,787,042 | Turnout | 65.3% | ||||
| Liberal to Green swing | 3.3% | |||||||
| Party | Seats | Votes | ||||||
|---|---|---|---|---|---|---|---|---|
| 2015 | Gained | Lost | 2019 | Total | % | Change (%) | ||
| Liberal | 40 | 1 | -6 | 35 | 1,447,712 | 34.2 | -1.5 | |
| Bloc Québécois | 10 | 22 | – | 32 | 1,376,135 | 32.5 | +13.2 | |
| Conservative | 12 | 1 | -3 | 10 | 677,283 | 16.0 | -0.7 | |
| New Democratic | 16 | – | -15 | 1 | 454,550 | 10.7 | -14.7 | |
| Green | – | – | – | – | 188,347 | 4.4 | +2.1 | |
| People's | – | – | – | – | 63,203 | 1.5 | New | |
| Independent and other | – | – | – | – | 23,408 | 0.1 | +0.1 | |
| Total | 78 | 4,230,638 | Turnout | 65.5% | ||||
| NDP to Bloc Québécois swing | 13.9% | |||||||
Voter demographics[edit]
Post-election analysis from Elections Canada[edit]
Elections Canada reported the following general characteristics of voter turnout in the election, compared to 2015:[11]
| Age group | All voters | Male | Female | ||||||
|---|---|---|---|---|---|---|---|---|---|
| 2019 | 2015 | Change (pp) | 2019 | 2015 | Change (pp) | 2019 | 2015 | Change (pp) | |
| First-time voters | 53.6 | 58.3 | 4.7 |
49.7 | 54.9 | 5.2 |
57.7 | 61.9 | 4.2 |
| Not first time | 54.2 | 55.1 | 0.9 |
50.2 | 52.0 | 1.8 |
58.4 | 58.3 | 0.1 |
| 18–24 yrs | 53.9 | 57.1 | 3.2 |
49.9 | 53.8 | 3.9 |
58.0 | 60.5 | 2.5 |
| 25–34 yrs | 58.4 | 57.4 | 1.0 |
55.5 | 54.3 | 1.2 |
61.3 | 60.6 | 0.7 |
| 35–44 yrs | 64.6 | 61.9 | 2.7 |
62.7 | 58.7 | 4.0 |
66.4 | 65.1 | 1.3 |
| 45–54 yrs | 68.1 | 66.6 | 1.5 |
66.7 | 63.6 | 3.1 |
69.5 | 69.6 | 0.1 |
| 55–64 yrs | 73.3 | 73.7 | 0.4 |
71.9 | 71.4 | 0.5 |
74.6 | 76.0 | 1.4 |
| 65–74 yrs | 79.1 | 78.8 | 0.3 |
78.9 | 79.0 | 0.1 |
79.2 | 78.6 | 0.6 |
| 75 yrs + | 68.6 | 67.4 | 1.2 |
72.3 | 74.1 | 1.8 |
65.7 | 62.8 | 2.9 |
| All ages | 67.0 | 66.1 | 0.9 |
65.5 | 64.1 | 1.4 |
68.5 | 68.0 | 0.5 |
From polling firms after Election Day[edit]
Per Ipsos[edit]
| Social group | Liberal | Conservative | NDP | Bloc | Green | PPC | Other |
|---|---|---|---|---|---|---|---|
| Actual results | |||||||
| Total vote | 33 | 34 | 16 | 8 | 6 | 2 | 1 |
| Gender | |||||||
| Male | 32 | 36 | 14 | 7 | 6 | 4 | 1 |
| Female | 31 | 31 | 22 | 7 | 7 | 2 | 1 |
| Age | |||||||
| 18–34 | 31 | 31 | 26 | 4 | 7 | 5 | 1 |
| 35–54 | 31 | 33 | 19 | 7 | 7 | 2 | 1 |
| 55+ | 32 | 39 | 12 | 9 | 5 | 2 | 1 |
Per Leger[edit]
| Social group | Liberal | Conservative | NDP | Bloc | Green | PPC | Other |
|---|---|---|---|---|---|---|---|
| Actual results | |||||||
| Total vote | 33 | 34 | 16 | 8 | 6 | 2 | 1 |
| Gender | |||||||
| Male | 31 | 37 | 15 | 8 | 6 | 2 | 1 |
| Female | 35 | 31 | 17 | 7 | 8 | 1 | 1 |
| Age | |||||||
| 18–34 | 30 | 29 | 24 | 6 | 9 | 1 | 1 |
| 35–54 | 32 | 37 | 15 | 5 | 6 | 2 | 2 |
| 55+ | 35 | 35 | 12 | 10 | 6 | 2 | 0 |
Per Abacus[edit]
| Social group | Liberal | Conservative | NDP | Bloc | Green | PPC | Other |
|---|---|---|---|---|---|---|---|
| Actual results | |||||||
| Total vote | 33 | 34 | 16 | 8 | 6 | 2 | 1 |
| Age | |||||||
| 18–29 | 34 | 23 | 26 | N/A | 9 | N/A | N/A |
| 30–44 | 34 | 35 | 18 | 7 | 5 | N/A | N/A |
| 45–59 | 33 | 36 | 12 | 8 | 8 | N/A | N/A |
| 60+ | 31 | 38 | 12 | 10 | 7 | N/A | N/A |
Strategic voting and vote splitting[edit]
Strategic voting may have played a significant part in determining the results. A survey by Angus Reid, issued several days after the election,[15] revealed that 23% of undecided voters did not make up their mind until election day. Of that number, 52% voted for the candidate and party they liked, while 48% voted based on who they disliked the least.[16] Of all undecided voters, 45% cast their vote for the Liberals, while 25% supported the Conservatives.[16] NDP voters were the least likely group to have made up their mind early on in the campaign.[16] An Ipsos-Reid exit poll conducted on election day[12] found that 26% of all voters made their choice as to try to ensure which party did not win, and the Liberals were the main beneficiary of such activity.[16] (Apparently these decisions were based on perception of the local situation so the vote was used - when used strategically - to try to produce the election of a local candidate not so well liked but definitely more liked than a competitor in that same district.)
Vote splitting skewed the results in many ridings. Vote splitting did not arise from multiple candidates of the same party running in a district (as that did not happen anywhere in Canada in this election) but from like-minded candidates of different parties running in the same district. Thus this analysis is based on somewhat arbitrary grouping of votes of like-minded parties despite different party labels into single voting blocks. Vote-splitting mainly benefited the Conservatives in Ontario and Metro Vancouver, the Liberals in Quebec and the Maritimes, and the NDP in BC and Ontario outside the GTA, while the Bloc benefited from multiple splits in the federalist parties, a wide group of all the nation-wide parties that ran candidates in Quebec. [17] The seats affected (where 2nd and 3rd place votes combined were greater than what the 1st place candidate received) are summarized thus:
Closest victories and greatest landslides[edit]
| Electoral district | 1st-place candidate | 2nd-place candidate | Margin | |||
|---|---|---|---|---|---|---|
| Port Moody—Coquitlam | BC | Nelly Shin | Bonita Zarrillo | 153 | ||
| Yukon | YK | Larry Bagnell | Jonas Smith | 153 | ||
| Richmond Hill | ON | Majid Jowhari | Costas Menegakis | 212 | ||
| Québec | QC | Jean-Yves Duclos | Christiane Gagnon | 325 | ||
| Hochelaga | QC | Soraya Martinez Ferrada | Simon Marchand | 328 | ||
| Kitchener—Conestoga | ON | Tim Louis | Harold Albrecht | 365 | ||
| Miramichi—Grand Lake | NB | Pat Finnigan | Peggy McLean | 370 | ||
| Coquitlam—Port Coquitlam | BC | Ron McKinnon | Nicholas Insley | 390 | ||
| Cumberland—Colchester | NS | Lenore Zann | Scott Armstrong | 453 | ||
| Sherbrooke | QC | Élisabeth Brière | Pierre-Luc Dusseault | 609 | ||
The total of the nine close results where Liberal were elected means a shift of just slightly more than 3205 voters away from Liberal candidates in those ridings would have lost the Liberals nine seats and given the Conservatives nine more, making the Liberal minority government weaker than it already was. Approximately 3000 votes is already anything at all when the votes are counted in the millions.
Significant results among independent and minor party candidates[edit]
Those candidates not belonging to a major party, receiving more than 1,000 votes in the election, are listed below:
Ridings won in major cities[edit]
-
 City of Toronto
 -
 Montreal Island
 -
 Vancouver
 -
 Ottawa
 -
 Calgary
 -
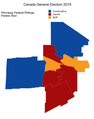 Winnipeg
 -
 Edmonton (including Edmonton-Wetaskiwin, part of which is outside the City of Edmonton)


Notes and references[edit]
Notes[edit]
- ^ 139 in Ontario and Quebec, and 5 in the Lower Mainland of BC.
References[edit]
- ^ "forty-third general election 2019 Official Voting Results". Elections Canada. Retrieved April 9, 2023.
- ^ Coyne, Andrew (October 22, 2019). "The Liberals didn't win the 2019 federal election, they just lost less than the Conservatives". National Post. Toronto. Archived from the original on August 8, 2021. Retrieved October 26, 2019.
- ^ Fournier, Philippe J. (October 27, 2019). "A 338Canada analysis: Where the Conservatives lost". Maclean's. Toronto. Archived from the original on July 6, 2021. Retrieved October 27, 2019.
- ^ Hébert, Chantal (October 25, 2019). "Election has left Conservatives in a bad place". Toronto Star. Archived from the original on October 27, 2019. Retrieved October 27, 2019.
- ^ Colpron, Suzanne (October 26, 2019). "Scheer a manqué de "couilles", estime Sylvie Fréchette" [Scheer lacked 'balls', figures Sylvie Fréchette]. La Presse (in French). Montreal. Archived from the original on October 27, 2019. Retrieved October 27, 2019.
- ^ "It's deeper than Andrew Scheer: The root of the Conservative Party's failure to launch". The Globe and Mail. Toronto. October 25, 2019. Archived from the original on October 27, 2019. Retrieved October 27, 2019.
- ^ Cornellier, Manon (October 26, 2019). "Reform Party 2.0?". Le Devoir (in French). Montreal. Archived from the original on October 26, 2019. Retrieved October 27, 2019.
- ^ Coyne, Andrew (October 31, 2019). "No point in Tories changing their leader if they don't change their message". National Post. Toronto. Archived from the original on August 8, 2021. Retrieved October 31, 2019.
- ^ "It's deeper than Andrew Scheer: The root of the Conservative Party's failure to launch, Part 2". The Globe and Mail. Toronto. October 29, 2019. Archived from the original on October 30, 2019. Retrieved October 30, 2019.
- ^ a b Grenier, Éric (October 24, 2019). "Canada's pollsters nailed the outcome of the federal election - mostly". CBC News. Toronto. Archived from the original on October 26, 2019. Retrieved October 26, 2019.
- ^ "Voter Turnout by Sex and Age". elections.ca. Archived from the original on January 23, 2021. Retrieved June 7, 2021.
this result differs from the Official Voting Results, which is based on registered electors
- ^ a b Simpson, Sean (October 22, 2019). "Election Day Poll". ipsos.com. Archived from the original on October 26, 2019. Retrieved October 26, 2019.
- ^ "Leger Post-Election Poll" (PDF). Leger. October 24, 2019. Archived (PDF) from the original on October 31, 2019. Retrieved October 31, 2019.
- ^ Coletto, David (October 24, 2019). "Federal vote by age. Liberal share was consistent across age groups, Conservative third among youth, first among seniors. From a post-election survey we conducted, Oct 22 to 24, n=1,500 #elxn43 #cdnpolipic.twitter.com/48FinTCZ4v". Twitter. Archived from the original on October 25, 2019. Retrieved November 29, 2019.
- ^ "Why and when did uncommitted voters lock in? Study shows Liberals benefitted most from strategic voting". angusreid.org. October 25, 2019. Archived from the original on October 26, 2019. Retrieved October 26, 2019.
- ^ a b c d Abedi, Maham (October 25, 2019). "'Hold your nose and vote': How undecided Canadian voters made up their minds". Global News. Archived from the original on October 26, 2019. Retrieved October 26, 2019.
- ^ a b Carman, Tara (October 23, 2019). "How vote-splitting helped — and hurt — the federal parties". CBC News. Toronto. Archived from the original on July 6, 2021. Retrieved October 26, 2019.
- ^ Berthiaume, Lee (October 22, 2019). "Down to the wire: The 10 closest races in Monday's federal election". Canadian Press. Archived from the original on August 8, 2021. Retrieved October 26, 2019.
- ^ a b "Federal election 2019: Trudeau's Liberals have a minority government. What now? A guide to Oct. 21's results". The Globe and Mail. Toronto. October 23, 2019. Archived from the original on July 6, 2021. Retrieved November 1, 2019.