Talk:Arctic sea ice decline
| This is the talk page for discussing improvements to the Arctic sea ice decline article. This is not a forum for general discussion of the article's subject. |
Article policies
|
| Find sources: Google (books · news · scholar · free images · WP refs) · FENS · JSTOR · TWL |
| Archives: 1Auto-archiving period: 600 days |
| This It is of interest to the following WikiProjects: | ||||||||||||||||||||||||||||||||||
| ||||||||||||||||||||||||||||||||||
| The contentious topics procedure applies to this page. This page is related to climate change, which has been designated as a contentious topic. Editors who repeatedly or seriously fail to adhere to the purpose of Wikipedia, any expected standards of behaviour, or any normal editorial process may be blocked or restricted by an administrator. Editors are advised to familiarise themselves with the contentious topics procedures before editing this page. |
Edits to Reflect IPCC AR6[edit]
Hi, I am a student at Brown University taking part to a class aiming to update Wikipedia articles based on the IPCC AR6. I recommend adding two paragraphs based on the assessed results from the IPCC AR6 report. The suggestions I make are the following:
- Adding the following paragraph in the middle of the section Ice-free summer:
- "The IPCC AR6 report instead assesses that there is "high confidence" that the Arctic Ocean will likely become practically ice-free in September before the year 2050 under all SSP scenarios.[1] "
- Adding the following paragraph at the end of the section Tipping point:
- "The IPCC AR6 report assesses with high confidence that there is no hysteresis and no tipping point in the loss of Arctic summer sea ice.[1] This can be explained by the increased influence of stabilizing feedback compared to the ice albedo feedback. Specifically, thinner sea ice leads to increased heat loss in the winter, creating a negative feedback loop. This counteracts the positive ice albedo feedback."
Moved an outdated textblock[edit]
I've cut out an outdated textblock from climate change and indigenous peoples. It might fit here although it's probably already here and with more up to date figures (?). This is the text block: ++++ According to satellite images, the Arctic region currently has the smallest area of ice in recorded history.[2] Climate change will lead to a faster rise in sea level, more frequent and increasingly intense storms and winds, and increased erosion from higher waves.[3] It additionally will lead to further decreases in the quantity of sea ice.[3] The albedo effect has had serious consequences with respect to the Arctic and the rest of the world. When ice melts, its light surface also disappears.[4] Lighter surfaces reflect more radiation, while darker surfaces absorb more radiation.[4] The conversion of sea ice to water makes more of the Earth's surface darker, further contributing to global warming as more radiation is absorbed.[4] This is known as a positive feedback loop.[4] Albedo is measured from a scale of 0 to 1, 0 corresponding to a perfect blackbody with absorbs all radiation and 1 corresponding to a body which reflects all incoming radiation.[5] From 1979 to 2011, the Arctic's overall albedo has decreased from 0.52 to 0.48, meaning it has overall had darker surfaces and absorbed more energy.[4] As of 2011, the Arctic ocean has received a further 6.4 +/- 0.9 W/m^2 of solar energy input.[4] Albedo is expected to decrease even further in the coming years.[6] Scientists have projected what is expected to happen should all of the Arctic summer sea-ice melted completely. If greenhouse gases are globally emitted as predicted, then the melting of the ice can potentially warm up the planet by approximately 0.2 °C.[6] +++ EMsmile (talk) 13:50, 8 June 2022 (UTC)
References
- ^ a b IPCC (2021). "Chapter 9" (PDF). IPCC AR6 WG1 2021. pp. 1247–1251.
- ^ Stoyanova, Irina L. (2013). "The Saami facing the impacts of global climate change". Climate Change and Indigenous Peoples: 287–312. doi:10.4337/9781781001806.00027. ISBN 9781781001806. Archived from the original on 2022-05-30. Retrieved 2020-12-04.
- ^ a b Overeem, Irina; Anderson, Robert S.; Wobus, Cameron W.; Clow, Gary D.; Urban, Frank E.; Matell, Nora (September 2011). "Sea ice loss enhances wave action at the Arctic coast". Geophysical Research Letters. 38 (17): n/a. Bibcode:2011GeoRL..3817503O. doi:10.1029/2011gl048681. ISSN 0094-8276.
- ^ a b c d e f Pistone, Kristina; Eisenman, Ian; Ramanathan, V. (2014-02-18). "Observational determination of albedo decrease caused by vanishing Arctic sea ice". Proceedings of the National Academy of Sciences. 111 (9): 3322–3326. Bibcode:2014PNAS..111.3322P. doi:10.1073/pnas.1318201111. ISSN 0027-8424. PMC 3948279. PMID 24550469.
- ^ Coakley, J.A. (2003), "Reflectance and Albedo, Surface", Encyclopedia of Atmospheric Sciences, Elsevier, pp. 1914–1923, doi:10.1016/b0-12-227090-8/00069-5, ISBN 978-0-12-227090-1, archived from the original on 2022-05-30, retrieved 2020-10-29
- ^ a b Wunderling, Nico; Willeit, Matteo; Donges, Jonathan F.; Winkelmann, Ricarda (2020-10-27). "Global warming due to loss of large ice masses and Arctic summer sea ice". Nature Communications. 11 (1): 5177. Bibcode:2020NatCo..11.5177W. doi:10.1038/s41467-020-18934-3. ISSN 2041-1723. PMC 7591863. PMID 33110092.
Reducing overlap with climate change in the Arctic?[edit]
There is still quite a long section on arctic sea ice decline in the article climate change in the Arctic. Should it perhaps be moved to here? Otherwise the two articles overlap too much? This article currently has higher pageviews than climate change in the Arctic. EMsmile (talk) 13:57, 8 June 2022 (UTC)
- Hi User:InformationToKnowledge, I see you have worked on this article. What do you think of my question that I posed a year ago? It's about this section in the other article: https://en.wikipedia.org/wiki/Climate_change_in_the_Arctic#Decline_of_sea_ice. I think we should probably move it to here and just leave an excerpt behind. Then also remove repetition and weed out outdated content. The reason for my suggestion is that otherwise we'd have to update and maintain similar content in two articles: here and also at climate change in the Arctic. EMsmile (talk) 08:55, 6 July 2023 (UTC)
- I remember looking at that other article last year. A lot of the sections there are already excerpts (as they should be), and with other flawed articles being of higher priority at the time, I didn't notice that there was still this overlap on sea ice.
- I certainly agree with your suggestion and will try to implement this on the weekend. While some material there clearly isn't needed anymore (i.e. that paragraph about the Fourth IPCC report!) other parts seem more helpful and would likely need more careful integration into the current, imperfect structure. InformationToKnowledge (talk) 16:28, 6 July 2023 (UTC)
Updating sources?[edit]
Majority of sources are current. A few are over two decades old and could be possibly updated. SkyBrooke (talk) 23:42, 24 January 2023 (UTC)
Make the lead into a better summary[edit]
I don't have time to do it myself right now, so I am just putting it here: the lead should be expanded a bit to become a better summary of the entire article. In particular, it should have some summary statements from the sections about the impacts on humans and impacts on wildlife. The lead is currently still on the short side (288 words), so we do have space to expand it. I think it should be around 400 to 500 words long in the end. EMsmile (talk) 09:10, 6 July 2023 (UTC)
- MOS:LEADLENGTH presents guidelines for length of leads. —RCraig09 (talk) 12:46, 6 July 2023 (UTC)
Remove misleading figure?[edit]
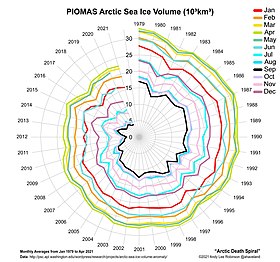
The (currently 3rd) figure on the "death spiral" of Atlantic ice is misleading and should be removed. By plotting the linear data in a circular polar plot it (1) amplifies the perceived amount of decline, which perceivably correlates with the area instead of length in this figure, and (2) makes it very difficult to see the year-by-year changes.

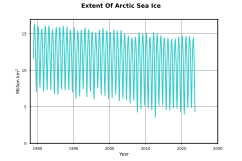
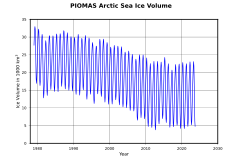
In contrast the two lead images of the article (shown here too) are better, because they present the same information in a way that is more perceptively clear and follows standard conventions.
This is important because the literature discusses how sea ice decline has substantially reduced since 2007 (see https://www.science.org/doi/10.1126/science.adh5158, figure 1B). It is an important scientific question to understand this phenomenon, a phenomenon clearly visible in raw data, but obscured by the misleading graph.
Sswamida (talk) 16:08, 5 September 2023 (UTC)
- I am undecided on this issue. Do you have any further evidence, publications perhaps, that question the validity of this death spiral graph? To me it looks quite good but I am not an expert. Pinging User:RCraig09 into the conversation in case he has an opinion. EMsmile (talk) 09:25, 19 September 2023 (UTC)
- User:Sswamida User:EMsmile — There is no question of "validity"; it's a question of human perception—which is arguable. The quantity being charted is volume (3 dimensions: length x width x height); the spiral graphic represents volume using two dimensions (roughly, radius x angle), while the conventional line chart represents volume using one dimension (height), so it is arguable which chart is objectively superior. Neither chart clearly shows the supposed decline in loss since 2007, described above. Separately, the spiral graphic actually enhances the ability to see 1979-to-2021 changes (arguably more important than the supposed 2007- changes) by their side-by-side comparison at "11:00" and "12:00". The line charts make year-to-year comparison of annual average volume harder, because of the wide variation between top and bottom of the ~sinusoid. Bottomline, since the charts contribute different perspectives, the article as a whole is not "misleading", and I think both chart types should remain. —RCraig09 (talk) 11:47, 19 September 2023 (UTC)
Recent edits[edit]
@RCraig09: Apols for the deletion, I was editing Kara Sea U-boat campaign and hadn't realied that I'd strayed into another article and disrupted it. Keith-264 (talk) 22:47, 29 October 2023 (UTC)
- No problemo. Happy editing! —RCraig09 (talk) 23:20, 29 October 2023 (UTC)
Why no update since 2022?[edit]
Is this because sea ice extent is the same or higher than it was in 2004? NSIDC Figure 3, “Average Monthly Sea Ice Extent, 1979 - 2024”? 2603:9000:2500:C503:A12C:130A:E9EF:C982 (talk) 02:05, 18 February 2024 (UTC)
- C-Class vital articles
- Wikipedia level-5 vital articles
- Wikipedia vital articles in Physical sciences
- C-Class level-5 vital articles
- Wikipedia level-5 vital articles in Physical sciences
- C-Class vital articles in Physical sciences
- C-Class Arctic articles
- Mid-importance Arctic articles
- WikiProject Arctic articles
- C-Class Environment articles
- High-importance Environment articles
- C-Class Climate change articles
- High-importance Climate change articles
- WikiProject Climate change articles


