
Talk:Income inequality in the United States/Archive 3
| This is an archive of past discussions. Do not edit the contents of this page. If you wish to start a new discussion or revive an old one, please do so on the current talk page. |
| Archive 1 | Archive 2 | Archive 3 | Archive 4 |
Bibliography of WP:SECONDARY literature
These secondary sources' descriptions of the relationship between economic inequality and growth need to be included in the article:
- Alesina, A., and Rodrik, D. (1994) "Distributive politics and economic growth" Quarterly Journal of Economics 109: 465-490. "Inequality in land and income ownership is negatively correlated with subsequent economic growth."
- Brescia, R. (2010) "The Cost of Inequality: Social Distance, Predatory Conduct, and the Financial Crisis" NYU Annual Survey of American Law 66. "'An imbalance between rich and poor is the oldest and most fatal ailments of all republics.' —Plutarch.... Income inequality and racial inequality ... crippled home finances and ultimately spread to all sectors of the economy."
- Clarke, G. (1995) "More evidence on income distribution and growth" Journal of Development Economics 47: 403-427. "Inequality is negatively, and robustly, correlated with growth. This result is not highly dependent upon assumptions about either the form of the growth regression or the measure of inequality."
- Easterly, W. (2007) "Inequality does cause underdevelopment: Insights from a new instrument" Journal of Development Economics 84(2): 755-776. "high inequality [is] a large and statistically significant barrier to prosperity, good quality institutions, and high schooling."
- Persson, T., and Tabellini, G. (1994) "Is Inequality Harmful for Growth? Theory and evidence" American Economic Review 84: 600-621. "Both historical panel data and postwar cross sections indicate a significant and large negative relation between inequality and growth."
- Perotti, R. (1996) "Growth, income distribution and democracy: what do the data say?" Journal of Economic Growth 1: 149-187. "More equal societies have lower fertility rates and higher rates of investment in education. Both are reflected in higher rates of growth."
- Rajan, R. (2010) Fault Lines: How hidden fractures still threaten the world economy Princeton University Press. "Growing income inequality ... helped precipitate the ongoing housing catastrophe."
- Stiglitz, J. (2009) "The global crisis, social protection and jobs" International Labour Review 148(1-2). "For a robust and sustained recovery, we must also address the underlying problem of insufficiency of aggregate demand, caused by global inequality as well as inequality within countries, and the build-up of excessive reserves."
- Temple, J. (1999) "The New Growth Evidence" Journal of Economic Literature 37(1): 112-156. "High inequality lowers growth, perhaps by raising social and political instability."
EllenCT (talk) 09:40, 9 January 2015 (UTC)
- No... not really. This is an encyclopedia, not an academic paper. The article is already a bloated hash of facts.Mattnad (talk) 18:08, 9 January 2015 (UTC)
- That the article is a bloated hash of facts is reflective of editing quality rather than the quality of its sources, and an unconvincing argument for excluding reliable literature. While quite a few of these may be better suited to the more-generic economic inequality article where Ellen has also suggested them, there are ways to write a reliable article that is still interesting and engaging for the reader. There may well be some real gems in these sources other than the excerpts she has provided, and in any case Wikipedia deems scholarly publications to be the most reliable. We should not dismiss them out of hand. John Shandy` • talk 06:21, 10 January 2015 (UTC)
Comments on specific references
I am moving this here from the article:
- Source #2, 37, 38, 47 & 48 are based on pre-tax data that in turn, provides biased and thereby flawed analysis. The tax rate for these higher income brackets is 39.6%. This dramatically alters the disparity portrayed in the article. Neither the article, nor the references provide data on Adjusted Gross Income or Effective Income to provide unbiased or balanced analysis. (ref name="newyorker.com">New Yorker-John Cassidy-Income Inequality in Six Charts-November 2013</ref>(ref name="AP-20130910">
It is unclear to me in which direction User:Momsterluv is saying the article is biased. It is associated with the following text which was out of chronological order at the top of this talk page. EllenCT (talk) 19:07, 12 January 2015 (UTC)
Source #2, 37, 38, 47 & 48 are based on pre-tax data that in turn, provides biased and thereby flawed analysis. The tax rate for these higher income brackets is 39.6%. This dramatically alters the disparity portrayed in the article. Neither the article, nor the references provide data on Adjusted Gross Income or Effective Income to provide unbiased or balanced analysis. — Preceding unsigned comment added by Momsterluv (talk • contribs) 18:19, 12 January 2015 (UTC)
- The issue, sort of, is that income inequality in the US is much worse, in terms of ranking among nations, after taxes and transfers than before. A huge amount of work remains to be done in so many places because of this problem. People here often have a hard time agreeing on what constitutes a secondary source in economics, so, it's not going to be easy to address. EllenCT (talk) 19:29, 12 January 2015 (UTC)
Discussion of Criticism Section ...
First. Footnote issues can be addressed ... (see below) Source #1: No need for source #1. The statement is addressed within the paragraph, and footnoted multiple times.
Source #3: Opinion piece referenced research by Stanford and University of Chicago professors that can now be directly attributed ... "It’s the Market: The Broad-Based Rise in the Return to Top Talent". Steven N. Kaplan and Joshua Rauh. University of Chicago/Stanford University. 2013. Here is a direct link to their research work ... http://faculty.chicagobooth.edu/steven.kaplan/research/krtop.pdf
Source #5: Alternative footnotes for "The Hidden Inequality In Socialism" are available ... Here are two direct sources for the footnote material ... http://econpapers.repec.org/paper/wpawuwpdc/0411012.htm http://heartland.org/policy-documents/hidden-inequality-socialism
Source #6: Footnote material was removed by the source. However, the original source of the information was located. "The Unequal State of America: Redistributing Up". Reuters, Deborah Nelson and Himanshu Ojha, Washington D.C., December 18, 2012. And direct link to the article ... http://www.reuters.com/subjects/income-inequality/washington
Source #10: Blog footnoted a research work that can be directly attributed ... National Tax Journal, December 2013, 66 (4), 893–912, "New Perspectives On Income Mobility And Inequality" Gerald Auten, Geoffrey Gee, and Nicholas Turner. Office of Tax Analysis, U.S. Treasury Department, Washington, DC, USA. And a link ... https://www.law.upenn.edu/live/files/2934-autengeeturner-perspectives-on-mobility-inequality.
Second. How to incorporate criticisms into the article ...
The article on Income Inequality in the United States, itself, is very lengthly (14,616 words), is repetitive, and contains heavy conjecture and opinion. In fact, one section has been already been demarcated by Wikipedia as "potentially unbalanced". Let's be honest here. The entire work is obviously written and massively-supported from a single perspective. Heavily-skewed sourcing of references. Every graphic and every chart supporting the case. In reviewing the existing text, there are a few weak criticisms (straw-man arguments) raised that are easily batted-down by the authors (Example: opening paragraphs ... "Although some have spoken out in favor of inequality, including NYU Law School Professor and Senior Lecturer at the University of Chicago, Richard Epstein, (who said "if, in fact, it turns out that inequality creates an incentive for people to produce and to create wealth, it’s a wonderful force for innovation")[30] (The notion that high levels of inequality drive innovation is disputed.[31])" Beyond spurious one-line examples such as this, there is no serious alternative discussion or viewpoint presented whatsoever within the article. Counterpoints and opinions are 'sandwiched'.
So the question is, how is balance brought to this article? The best way to do this is to present criticisms as a distinct and separate set of arguments. The reason for this is two-fold ... first, this enables both sides to present their perspectives in their entirety, without interference or distraction. Second, considering that the article runs on at such length, it would be easy to bury even legitimate critical arguments into massive textual paragraphs and smother them. The criticism section as it exists here is 1800 words long. Roughly twelve percent of the length of the original article. This is very appropriate, especially when they incorporate five disputes involving statistical facts, and one discussion of the causation of income inequality.
For the record, the argument is not whether income inequality exists or not. It does. The argument is ... to what degree it exists, using what kind of data to support, and what arguments are made with it. Case in point ... the article discusses the top 1 percent as a monolithic group of wealthy people, all of whom have gained at the expense of the 99 percent. This is factually untrue on two levels. Only the top .5 percent have gained (particularly the top .1 percent). Those between the top 1 percentile and top .5 percentile are treading water ... just like the rest of the 99 per centers. This is proven in research by Emmanuel Saez, who is used extensively within the original article. But the Wiki article ignores this important fact entirely ... in fact, it misrepresents the truth every time it mentions "top 1 percent". It insidiously groups people who have not gained with those who have gained. The very use of the term "top 1 percent" reveals political bias, because it has become the whipping boy of the cause, even if it is factually deceiving the public. The other untruth ... the Congressional Budget Office, Pew, and Brookings Institutions have all conclusively confirmed that "the rich have not gained at the expense of the poor", yet this is a theory insinuated throughout the main article, and specifically mentioned at least once. Perception becomes reality ... but factually not true.
- I do not support using Wikipedia to segregate criticism or praise. It is not neutral and that is our goal. I don't say that the article doesn't have issues and problems, just that adding to it is not a solution.--Mark Miller (talk) 02:37, 14 September 2014 (UTC)
- After reading through that, I have to say that there are some biases that I see and don't believe you have proven your point that the article would be improved with a segregated criticism section. Some of the content just doesn't belong here. Some is the opinion of the authors an some may not even be from reliable sources to use.--Mark Miller (talk) 02:43, 14 September 2014 (UTC)
- I'm going to leave the rest of this up to the editors here to mash out. Happy editing!--Mark Miller (talk) 10:15, 14 September 2014 (UTC)
- Perhaps the section was too long, but there's been a lot pushing of Thomas Piketty work across the project. It would be good to have a contained and cogent section summarizing the counterpoints. There's enough here to create its own article IMHO and then use main article templates as well. This article by its topic also attracts a lot of POV both in which sources are included, as well as the level of detail.Mattnad (talk) 11:59, 14 September 2014 (UTC)
- I'm going to leave the rest of this up to the editors here to mash out. Happy editing!--Mark Miller (talk) 10:15, 14 September 2014 (UTC)
- Mark. All of the content of the original income inequality article is 'interpreted' data and statistics. The old line ... "There are lies, damned lies, and then there are statistics" applies here. Thus, I think any objective person would agree that this topic is subject to a high degree statistical analysis driven by political conjecture and POV (in both directions). So 'reliable sources' is a relative issue (it depends on who you think is reliable). One of the essential points, then ... if we are to be neutral ... is that this article should reflect all relevant viewpoints. This does not occur when the only primary resources used in the article discussion are heavily biased in one direction (i.e. - Piketty: Former French Socialist Party Economic Advisor, Paul Krugman: Conscience of a Liberal, Larry Bartels:"Liberal Political Scientist", Jared Bernstein:Obama Economic Advisor, Thomas Edsall:Political Editor Huffington Post, Elizabeth Warren:Liberal Politician, and a plethora of euro-centric economists). I acknowledge that Wiki is heavily influenced by left and left-center intellectuals who will ardently defend an article like this. I understand that. But the criticisms, for the most part, do not challenge the essence of the article. My focus is on only the five criticisms of fact that are essentially inarguable ... and necessary for full consideration of the subject matter, and one important paragraph devoted to a discussion of economic vs political income inequality. I believe, as the previous person above me here seems to concur, that these criticisms either deserve a "cogent section summarizing the counterpoints" or its own article.Tolinjr (talk) 14:15, 14 September 2014 (UTC)
- Some of this should be incorporated in the article on Piketty's recent book, if similar arguments aren't there already. I can't see which parts are intended to address the specific points made in this article. Most of the sections which pertain to unsettled questions in this article do include detailed exposition of both opposing views. Are you okay with trimming the portions which don't conform to WP:RS? Some of this material would be appropriate in Economic inequality#Perspectives since clearly none of it is intended to be specific to the U.S., even if many of the examples draw from U.S. data. EllenCT (talk) 22:19, 14 September 2014 (UTC)
- Mark. All of the content of the original income inequality article is 'interpreted' data and statistics. The old line ... "There are lies, damned lies, and then there are statistics" applies here. Thus, I think any objective person would agree that this topic is subject to a high degree statistical analysis driven by political conjecture and POV (in both directions). So 'reliable sources' is a relative issue (it depends on who you think is reliable). One of the essential points, then ... if we are to be neutral ... is that this article should reflect all relevant viewpoints. This does not occur when the only primary resources used in the article discussion are heavily biased in one direction (i.e. - Piketty: Former French Socialist Party Economic Advisor, Paul Krugman: Conscience of a Liberal, Larry Bartels:"Liberal Political Scientist", Jared Bernstein:Obama Economic Advisor, Thomas Edsall:Political Editor Huffington Post, Elizabeth Warren:Liberal Politician, and a plethora of euro-centric economists). I acknowledge that Wiki is heavily influenced by left and left-center intellectuals who will ardently defend an article like this. I understand that. But the criticisms, for the most part, do not challenge the essence of the article. My focus is on only the five criticisms of fact that are essentially inarguable ... and necessary for full consideration of the subject matter, and one important paragraph devoted to a discussion of economic vs political income inequality. I believe, as the previous person above me here seems to concur, that these criticisms either deserve a "cogent section summarizing the counterpoints" or its own article.Tolinjr (talk) 14:15, 14 September 2014 (UTC)
- EllenCT. Appreciate the input. We are open to inclusion on the Piketty article, however, there are several major assumptions (or claims) made throughout the 'Income Inequality in the United States' article that are factually incorrect. This criticism section addresses those inaccuracies directly. You mention "detailed exposition of both opposing views". From what I could see, there were a handful of brief passing one or two sentence comments with opposing viewpoints (re: Executive and labor pay, Globalization, and a quick quote from Paul Ryan, perhaps one or two more) wherein a comment is couched (or buried) within a particular heading and then it is summarily dismissed in subsequent paragraphs of argument. This is not detailed exposition, nor is it a cogent argument. These were hand-selected one-liners by the person writing the original article for the purpose of making a counter-point in support of their own argument. As far as Reliable Sources, it can be argued that raw census data (as used heavily throughout the original article) is not a reliable source of data, precisely due to limitations expressed in the above criticism section. Also, there is an issue with 'selective' use of CBO data ... for example, supporters of the article do not want to include 'in-kind' or 'after-tax' income data because it weakens their political argument (they want to show the widest income gap possible). But the Brookings Institute analysis, included in the criticism section, using the same CBO data makes almost the exact opposite point because it adds in those important (and growing) factors. So which one is more reliable? There are literally dozens of resources quoted throughout the original article that are shaky at best ... liberal journalists quoting Horatio Alger, NetJets, and "Republican-World" ... union bosses and admittedly left-wing political scientists ... there was even a poet quoted in the text. There is such a preponderance of 'soft' journalistic analysis and opinion mixed in with the data that the article is virtually an opinion piece. Final point, we are not trying to assert that income inequality does not exist, nor are we saying the income inequality is a good thing (those are the straw man arguments). What we are saying is that there are important assumptions being made by the proponents that are incorrect, that some of their data is inappropriate for their analyses, that key 'facts' being thrown around (i.e. "Top 1 Percent" and "The rich are rich at the expense of the poor") are factually incorrect or misleading, and that their solution of central planning/socialist government also contributes to income inequality, but in a vastly different way. How are any of these arguments any different or less appropriate for the article than what is in it already? In an article as controversial as this, for the purpose of keeping it neutral, it only makes sense to include input representing different viewpoints. Right now, it is a singular piece of work, written by authors ... all of whom share the same point of view. If Wikipedia wants to be as neutral as it claims, it must either be willing to legitimately incorporate a dissenting argument or provide a separate platform (article) to achieve it.Tolinjr (talk) 13:46, 15 September 2014 (UTC)
- I can assure you beyond a shadow of any doubt that the authors of this article most certainly do not share the same point of view. I understand your points about what you see as insufficient weight given to both sides in some sections, and I would urge you to add your additional perspective to the existing sections that you see as unbalanced instead of creating a new top-level unintegrated section as per WP:CRITS, in addition to my other suggestions above. Please try to rely on reliable sources such as WP:SECONDARY academic journal literature review articles or textbooks from widely regarded experts, instead of blogs, op-eds, and advocacy websites. EllenCT (talk) 19:37, 15 September 2014 (UTC)
- EllenCT. Appreciate the input. We are open to inclusion on the Piketty article, however, there are several major assumptions (or claims) made throughout the 'Income Inequality in the United States' article that are factually incorrect. This criticism section addresses those inaccuracies directly. You mention "detailed exposition of both opposing views". From what I could see, there were a handful of brief passing one or two sentence comments with opposing viewpoints (re: Executive and labor pay, Globalization, and a quick quote from Paul Ryan, perhaps one or two more) wherein a comment is couched (or buried) within a particular heading and then it is summarily dismissed in subsequent paragraphs of argument. This is not detailed exposition, nor is it a cogent argument. These were hand-selected one-liners by the person writing the original article for the purpose of making a counter-point in support of their own argument. As far as Reliable Sources, it can be argued that raw census data (as used heavily throughout the original article) is not a reliable source of data, precisely due to limitations expressed in the above criticism section. Also, there is an issue with 'selective' use of CBO data ... for example, supporters of the article do not want to include 'in-kind' or 'after-tax' income data because it weakens their political argument (they want to show the widest income gap possible). But the Brookings Institute analysis, included in the criticism section, using the same CBO data makes almost the exact opposite point because it adds in those important (and growing) factors. So which one is more reliable? There are literally dozens of resources quoted throughout the original article that are shaky at best ... liberal journalists quoting Horatio Alger, NetJets, and "Republican-World" ... union bosses and admittedly left-wing political scientists ... there was even a poet quoted in the text. There is such a preponderance of 'soft' journalistic analysis and opinion mixed in with the data that the article is virtually an opinion piece. Final point, we are not trying to assert that income inequality does not exist, nor are we saying the income inequality is a good thing (those are the straw man arguments). What we are saying is that there are important assumptions being made by the proponents that are incorrect, that some of their data is inappropriate for their analyses, that key 'facts' being thrown around (i.e. "Top 1 Percent" and "The rich are rich at the expense of the poor") are factually incorrect or misleading, and that their solution of central planning/socialist government also contributes to income inequality, but in a vastly different way. How are any of these arguments any different or less appropriate for the article than what is in it already? In an article as controversial as this, for the purpose of keeping it neutral, it only makes sense to include input representing different viewpoints. Right now, it is a singular piece of work, written by authors ... all of whom share the same point of view. If Wikipedia wants to be as neutral as it claims, it must either be willing to legitimately incorporate a dissenting argument or provide a separate platform (article) to achieve it.Tolinjr (talk) 13:46, 15 September 2014 (UTC)
- Thank you EllenCT. First, without naming names, I can assure you that many of the key contributors to the main article, particularly since early 2014, do have a common point of view (userboxes in editor profiles can be very revealing). You have noted that some of my sources are journalists ... suggesting that they are not reliable sources, yet the original article is rife with commentary and analysis by journalists (Tim Noah (10+ times), James Surowiecki, and perhaps fifty others, as well as several of Paul Krugman's online "Blogs" and his political "OpEds"). Who decides what journalist is reliable or not? Wikipedia has a policy of not citing blogs or opinion pieces ... unless they are from Paul Krugman? Furthermore, there are almost one hundred and fifty citations in the original article sourcing magazines such as the Huffington Post (8 times), New Republic (8 times), Slate (6 times), Mother Jones (3 times), Salon, Politico, Rolling Stone, Harpers, Bloomberg, et. al. Yet, somehow, when I quote the Wall Street Journal, National Affairs, Economist, Forbes, U.S. News & World Report, or Brookings Institution, those sources are brought into question and somehow not legitimate? (Interestingly, 10 of the 17 sources cited in the criticism section were also cited in the original article). As a matter of fact, of the 351 sources cited in the original article, just about one third are directly from the census bureau or other scientific citations. The rest are magazines, journals and blogs. Please help me understand why this is. It seems like a moving target. By the way, I really love citation number 219 in the original article ... Intellectual Garbage Collection: The Unreliability of Alan Reynolds (a blog). It is very evident that we are not playing on a level field here. Still, I keep coming back to the main point ... the points presented in the proposed criticism section specifically address incorrect assumptions and facts presented in the original article, with brief discussion supporting why they are relevant. They do not challenge the essence or foundations of the article. The question I have is ... why the hypersensitivity to it? The criticism section represents approximately ten percent of the total article, yet it is considered to have undue weight? Is the subject so sacrosanct that it is above reproach? Truth be told, there are many aspects of article that need correction, clarity, and balance ... and this proposed section helps provide it. Making inputs on a piecemeal basis, as you recommend ... particularly in an article as massive and slanted as this, reduces them to insignificance. Furthermore, subsequent editors would whittle-away at them over time until they ultimately disappeared, one at a time. That is assured. There needs to be a stand-alone section.
- Firstly, professional journalist and expert sources are fine, even when they publish in blogs. I think WP:BLOGS covers the details. Krugman's blog is actually a New York Times column, and he is an acknowledged expert with a history of fact-checking and accuracy as per Paul Krugman#Awards. Noah's articles as used here are WP:SECONDARY reports on other sources in long-form. Having said that, I very strongly prefer peer-reviewed literature reviews in academic journals, but sometimes I am forced to use a WP:NWSRC source when salient facts likely to be called in to question would be behind a paywall otherwise. I only started editing here a couple years ago, and most of the article has existed far prior, so I can't speak for the bulk of the editors who came before me. Since then, I've mostly only been involved with the "economic growth" section because my senior thesis was on Ostry and Berg's 2011 IMF work, where they overcame decades of inconclusive regression by using growth run lengths instead of the (now known to be meaningless) year-over-year forecasting. If you include your perspectives in the individual sections, I don't see why you think that would reduce them to insignificance. People use encyclopedia articles to find information on a specific topic, and that means they are looking for information on, for example, intergenerational economic mobility more often than they are looking for criticism of intergenerational mobility ideas. Does that make sense? EllenCT (talk) 22:18, 15 September 2014 (UTC)
- Thank you EllenCT. First, without naming names, I can assure you that many of the key contributors to the main article, particularly since early 2014, do have a common point of view (userboxes in editor profiles can be very revealing). You have noted that some of my sources are journalists ... suggesting that they are not reliable sources, yet the original article is rife with commentary and analysis by journalists (Tim Noah (10+ times), James Surowiecki, and perhaps fifty others, as well as several of Paul Krugman's online "Blogs" and his political "OpEds"). Who decides what journalist is reliable or not? Wikipedia has a policy of not citing blogs or opinion pieces ... unless they are from Paul Krugman? Furthermore, there are almost one hundred and fifty citations in the original article sourcing magazines such as the Huffington Post (8 times), New Republic (8 times), Slate (6 times), Mother Jones (3 times), Salon, Politico, Rolling Stone, Harpers, Bloomberg, et. al. Yet, somehow, when I quote the Wall Street Journal, National Affairs, Economist, Forbes, U.S. News & World Report, or Brookings Institution, those sources are brought into question and somehow not legitimate? (Interestingly, 10 of the 17 sources cited in the criticism section were also cited in the original article). As a matter of fact, of the 351 sources cited in the original article, just about one third are directly from the census bureau or other scientific citations. The rest are magazines, journals and blogs. Please help me understand why this is. It seems like a moving target. By the way, I really love citation number 219 in the original article ... Intellectual Garbage Collection: The Unreliability of Alan Reynolds (a blog). It is very evident that we are not playing on a level field here. Still, I keep coming back to the main point ... the points presented in the proposed criticism section specifically address incorrect assumptions and facts presented in the original article, with brief discussion supporting why they are relevant. They do not challenge the essence or foundations of the article. The question I have is ... why the hypersensitivity to it? The criticism section represents approximately ten percent of the total article, yet it is considered to have undue weight? Is the subject so sacrosanct that it is above reproach? Truth be told, there are many aspects of article that need correction, clarity, and balance ... and this proposed section helps provide it. Making inputs on a piecemeal basis, as you recommend ... particularly in an article as massive and slanted as this, reduces them to insignificance. Furthermore, subsequent editors would whittle-away at them over time until they ultimately disappeared, one at a time. That is assured. There needs to be a stand-alone section.
- My background is in both economics and business. My economics thesis was an analysis of the cause and effects of domestic business flight to the southern U.S. (1981). The point at hand is that I have spent a bit of time reviewing the edit history of this article and have noted a handful of wiki editors who have taken it upon themselves to 'police' political articles and whose implicit purpose, it seems, is to 'protect' them from precisely what I am trying to do. I can guarantee you that each and every sentence added piecemeal will be ... A. Challenged immediately ... B. Summarily erased by a protective activist editor ... or C. Buried in a 'talk' section like this. Rest assured, anything currently in the article that is somewhat critical was put there for the express-purpose of being destroyed by a subsequent counter-point. The only way to make sure that the criticisms are legitimately presented and safeguarded is with its own section (or its own page). This would shield it somewhat from activist 'editor-erosion'. What Wiki really needs is a way to facilitate a team of fair-minded 'reviewers'. Perhaps that is what mediation is. We will find out soon enough.
- Please don't take the WP:CRITS setback personally. The WP:NPOV policy usually means that we try to represent the top two contending positions, with as much point-counterpoint as necessary for the reader to make an informed decision about which is most persuasive. But you are correct that there is only one way to find out how fair people will be with your contributions. What do you think about "Confidence Intervals for the Suits Index" (PDF). National Tax Journal. March 2003. Retrieved 2007-05-16.? EllenCT (talk) 20:50, 16 September 2014 (UTC)
- My background is in both economics and business. My economics thesis was an analysis of the cause and effects of domestic business flight to the southern U.S. (1981). The point at hand is that I have spent a bit of time reviewing the edit history of this article and have noted a handful of wiki editors who have taken it upon themselves to 'police' political articles and whose implicit purpose, it seems, is to 'protect' them from precisely what I am trying to do. I can guarantee you that each and every sentence added piecemeal will be ... A. Challenged immediately ... B. Summarily erased by a protective activist editor ... or C. Buried in a 'talk' section like this. Rest assured, anything currently in the article that is somewhat critical was put there for the express-purpose of being destroyed by a subsequent counter-point. The only way to make sure that the criticisms are legitimately presented and safeguarded is with its own section (or its own page). This would shield it somewhat from activist 'editor-erosion'. What Wiki really needs is a way to facilitate a team of fair-minded 'reviewers'. Perhaps that is what mediation is. We will find out soon enough.
- Even the most jaded Wikipedia editor can observe the partisan nature of the original article (although some may never admit it). The stunner for me is how openly this partisanship is practiced, both regarding the information presented to the public and how editing is practiced behind the scenes. Wikipedia acknowledges this somewhat in the article "Criticism of Wikipedia" (yes, they apparently do allow some 'criticism' articles). Wikipedia is still the standard for online encyclopedic information and I think it is important to make it as fair and accurate is we can. I tried to do this before and was shot down by an avowed hard-core socialist editor. I took some advice and re-edited it to remove any possible POV. As it stands now, it is strictly a list that corrects a number of incorrect facts and assumptions in the main article, with brief explanations why. Nevertheless, the feedback I am getting here is that the article is "perfectly fine as it is" ... "don't mess with it" ... "we like it just like this". "If you would like to insert a sentence or so, in the middle of a paragraph in order to qualify it, help yourself, try to sprinkle a few in here and there ... no guarantees we will accept it." It is incredulous that in a 15,000 word article, there can be no room for legitimate discussion and dissent. Sad, really. I read the "Suits Index" article and was immediately reminded why I hated econometrics!! Actually, I'm in favor of starting over and going to a consumption tax.
Then I support restoring your criticism section, because it is less likely to be read by people looking for information on which to base a decision, and an encyclopedia which presents such radical regressivism as fringe instead of mainstream is an improvement over an encyclopedia which presents radical views held by only a tiny proportion of economists on equal footing with mainstream views. EllenCT (talk) 03:16, 17 September 2014 (UTC)
- Perhaps you took my comments wrong. What I was attempting to do was articulate that econometrics was an aspect of economics that I never really enjoyed. No more than that. However, it must be frustrating for you to observe how ineffective the Keynesian 'mainstream' policy of trillions of dollars of government stimulus, printing, and borrowing money have been ... virtually stagnant economic growth, only increases have been in low-wage and part-time employment, illusionary stock market growth ... and in the end, we will all get to enjoy the benefits of a massive inflationary bubble-burst in the near future. Keynesian policy is corrosive and insidiously damaging to any legitimate free-market growth. It has been employed now for six years now and the results speak for themselves.Tolinjr (talk) 21:37, 17 September 2014 (UTC)

- I believe you are mistaken. Even the most strident Chicago School adherents recognize the basic principles of anti-cyclical stimuli, which are best illustrated by the "high" and "low" lines on the graph to the right. There is no evidence of inflation, and the risk of deflation continues to dominate. Please review WP:TALK. It is generally bad form to add text to the end of someone else's paragraph without starting a new paragraph on talk pages. EllenCT (talk) 21:42, 1 October 2014 (UTC)
- We disagree as to which views are mainstream. Still, the "criticism" section probably should not exist; the individual mainstream criticisms should be placed near where the minority views (not presented as mainstream) are, although some of the criticisms (and the minority views) should only be in the parent article, income inequality, as they do not refer specifically to the United States. I see now that economical inequality needs to be separated into income inequality and wealth inequality, or income inequality in the United States and wealth inequality in the United States need to be combined. — Arthur Rubin (talk) 16:37, 17 September 2014 (UTC)
- FWIW, I offer a passer-by's opinion, stumbling on this page as I browse the web for thoughts on Piketty. I am *absolutely not* sophisticated in economics terms, but since in that sense I am perhaps a typical reader I have to say there is something of a bad smell of bias about this article, quite specifically because I found it very hard to find a "Criticism" section. Given the complexity of this topic, my expectation is that there should at least be one top level section expressing dissent against what seems to be an otherwise surprisingly homogenous opinion throughout the rest. The feeling is similar to that experienced on hearing that in somewhere like North Korea there was a 98% turnout at an election where everyone voted for the current leader. It Just Doesn't Happen in normal, diverse and free places. Of course I may be wrong, and it may simply be that like evolution, the nature, level and implications of US income inequality actually *are* indisputable facts, argued against only by kooks or "inequality deniers". But I'm thinking that's unlikely. A decently done, and credibly sized "Criticism" section would, I think, help overall credibility. As JS Mill said, "if [an opinion] is not fully, frequently, and fearlessly discussed, it will be held as a dead dogma, not a living truth". Or, failing that, maybe an explicit statement saying "There Are No Dissenters Against This Position" would be useful to clarify what the article is currently already implying (little subsection references to dissent notwithstanding) Thomask0 (talk) 04:02, 17 January 2015 (UTC)
- Thanks for your feedback. That U.S. income inequality (pre- and after-tax) has risen significantly since the 1970s is firmly established; the CBO reports are excellent sources for that and represent the review of many other sources. Disputing that is like arguing Elvis is still alive and merits very little text. However, the causes and economic effects are very much in dispute. For example, even Paul Krugman is still searching for empirical evidence of the negative effects on economic growth; he is not on the same page with Stiglitz on that issue. As we make edits, we'll continue to keep that in mind and try to make that distinction clearer.Farcaster (talk) 19:10, 17 January 2015 (UTC)
- Krugman alternates between saying he's not convinced and publshing this sort of thing. I suspect he's trying to take a Socratic approach. See also [1]. EllenCT (talk) 02:55, 18 January 2015 (UTC)
- @Thomask0: there is plenty of dissent, but very little of it gets published in the peer-reviewed literature, even less in the WP:SECONDARY economics literature, and essentially none in the peer reviewed literature reviews, which we have to depend on as the most reliable sources. This article has a section devoted to dissenting views, which are more numerous here than in other articles on the topic. EllenCT (talk) 03:00, 18 January 2015 (UTC)
- @EllenCT:, which section is devoted to dissent? Do you mean Income_inequality_in_the_United_States#Views_that_income_inequality_does_not_slow_growth? Thomask0 (talk) 04:21, 19 January 2015 (UTC)
- That's right. It's sourced to an op-ed, to labor journal articles I'm pretty sure don't say anything close to what the summaries say, a blog post, and three more op-eds. Wikipedia is never supposed to use op-eds as a source. What do you think is the best peer reviewed WP:SECONDARY source claiming that inequality is beneficial? EllenCT (talk) 05:19, 19 January 2015 (UTC)
- @EllenCT:, which section is devoted to dissent? Do you mean Income_inequality_in_the_United_States#Views_that_income_inequality_does_not_slow_growth? Thomask0 (talk) 04:21, 19 January 2015 (UTC)
- Thanks for your feedback. That U.S. income inequality (pre- and after-tax) has risen significantly since the 1970s is firmly established; the CBO reports are excellent sources for that and represent the review of many other sources. Disputing that is like arguing Elvis is still alive and merits very little text. However, the causes and economic effects are very much in dispute. For example, even Paul Krugman is still searching for empirical evidence of the negative effects on economic growth; he is not on the same page with Stiglitz on that issue. As we make edits, we'll continue to keep that in mind and try to make that distinction clearer.Farcaster (talk) 19:10, 17 January 2015 (UTC)
Innate talent as a factor
I made an edit on Feb 16th adding genetics as a contributing cause to income inequality, with a recent study cited in support. My purpose here isn't to try to get that edit reinstated, because I'm not sure that it represents the best way on this page to make my point. Rather, my purpose is to suggest a way that this article can be improved, so that in the future someone more experienced with Wikipedia editing and/or more expert on the topic of innate talent can make these improvements.
The edit in question was originally removed with the justification that it gave undue weight to a fringe viewpoint. However, the notion that genetics affects innate talent, and that innate talent is a significant factor in an individual's income is not a fringe view.
From the guidelines of WP:UNDUE, it states that "in determining proper weight, we consider a viewpoint's prevalence in reliable sources, not its prevalence among Wikipedia editors or the general public." While the concept of innate talent is surely not popular with the editor who undid my edit, it is in fact mainstream among the scientists of who study genetics. For example, the study I originally cited was tweeted by Stephen Pinker: https://twitter.com/sapinker/status/567017304735903745. And it's not just one or two prominent scientists. There is broad consensus that traits such as IQ are strongly heritable, and IQ is widely recognized as strong predictor of income (or even the single best predictor). These views are backed by such organizations as the American Psychological Association. No credible geneticist is arguing that permanent income is 0% heritable. Rather, they are arguing about whether it's 30% or 60% heritable. To deny in the genetics community that genes significantly impact income would be like denying climate change among climate scientists. The science here is well established, so if you don't know what you're talking about, don't interfere.
But even if it's true that genetics significantly influences an individual's income, does it deserve a mention in this article? Yes, it does! The fact that a major source of income inequality is innate radically changes the debate in the US. For example, here's an argument that I'm sure would resonate with the kind of people who created this slanted article: If some people are born with a talent that lets them earn a high income, while others are born without such a gift, then it would seem fairer to help those with unlucky genes by providing them with extra financial assistance, just as someone born with a genetic disease should qualify for assistance if treatment is costly.
In summary, this article is missing an important discussion of innate talent, and I hope that someone who comes along and reads this will take up the colossal task of getting it into the article. — Preceding unsigned comment added by 71.61.176.11 (talk) 21:56, 6 March 2015 (UTC)
- The problem is that your source says the data are inconclusive, because "most existing efforts to find associations between genetic variation and economic behavior are based on samples that are too small to ensure adequate statistical power." EllenCT (talk) 15:30, 7 March 2015 (UTC)
- This problem of small samples that you quote was mentioned as an example of what challenges researchers face today, but certainly does not imply the authors believe "the data are inconclusive," as you say. In fact, the authors write that "the basic finding that income is moderately heritable has now been repeatedly replicated in a variety of samples, including nontwin samples (Rowe et al. 1999, Björklund et al. 2005)." In addition, one of the main findings of the paper is that permanent income (i.e., income averaged over 20 years) is even more heritable than income. I'm afraid you could hardly be more wrong. — Preceding unsigned comment added by 71.61.176.11 (talk) 23:39, 7 March 2015 (UTC)
- Consider subsequent publications citing your source, e.g. [2] and [3]. The whole line of inquiry is completely inconclusive, and the chains of causality supporting the meager association which does exist aren't solely genetic. They are partly behaviorial, and behavior does not exist outside of the context of social situations. You might want to have a look the history of Wikipedia's race and intelligence article and the disputes surrounding it. You aren't the first to hope to push this sort of thing here, and you won't be the last. You might also want to reflect on your source's conclusions: "We found a promising association between a particular genetic variant and educational attainment. The association was biologically plausible, associated with cognitive function, and replicated in a nonoverlapping sample from the same respondent population. The association then failed to replicate in three other samples. We further illustrate the widespread nonreplicability of candidate gene associations by reviewing a systematic study we conducted of previously published associations between cognitive ability and 12 candidate genes. Across three new, large samples, we are unable to replicate these associations." EllenCT (talk) 06:13, 8 March 2015 (UTC)
- I think you have confused the question of whether income is influenced by genes with the question of which genes in particular influence income. For many years we have been able to study the degree to which different outcomes are heritable, by comparing outcomes of people of different degrees of relation (e.g., comparing identical twins which share 100% of their genes, or siblings which share 50% of the genes that vary). However, only recently has it been possible to sequence people's genes cheaply enough to run the correlations and identify which individual genes affect which outcomes. The quotation you cite as well as the publications you link to both talk about the difficulty of this second task. But it doesn't matter whether we can identify the specific genes that affect income, because we already know what their aggregate impact is from other studies like twin studies. All of this is extremely elementary for those who study this field. Your concerns do not undermine the original source's view (and the views of those cited in that source, and probably 99% of geneticists) that income is moderately heritable.
- But I also think you've gotten the wrong idea here, seeing as you've referred me to the race and intelligence talk page. It's unfortunate that this even needs to be said in today's world, but, no, my invocation of genetics has no underlying racial motivation. That people are born with varying amounts of talent has nothing to do with race. The source I cited used data from Swedish twins, all largely within a single race, and found that their genes significantly influenced income. I also believe that many other factors besides genes are at work in influencing income in the US, and with regard to the genetic factor, I think I have seen papers that say heritability of many behaviors/outcomes is lower for poorer Americans.
- The only point I'm trying to make is really quite reasonable. We all know that people have varying degrees of talent at earning money. Some moderate portion of that variation is driven by genes. Is that really so surprising? In the end, however, it only matters that the authoritative sources agree. — Preceding unsigned comment added by 71.61.176.11 (talk) 21:46, 8 March 2015 (UTC)
- Consider subsequent publications citing your source, e.g. [2] and [3]. The whole line of inquiry is completely inconclusive, and the chains of causality supporting the meager association which does exist aren't solely genetic. They are partly behaviorial, and behavior does not exist outside of the context of social situations. You might want to have a look the history of Wikipedia's race and intelligence article and the disputes surrounding it. You aren't the first to hope to push this sort of thing here, and you won't be the last. You might also want to reflect on your source's conclusions: "We found a promising association between a particular genetic variant and educational attainment. The association was biologically plausible, associated with cognitive function, and replicated in a nonoverlapping sample from the same respondent population. The association then failed to replicate in three other samples. We further illustrate the widespread nonreplicability of candidate gene associations by reviewing a systematic study we conducted of previously published associations between cognitive ability and 12 candidate genes. Across three new, large samples, we are unable to replicate these associations." EllenCT (talk) 06:13, 8 March 2015 (UTC)
- This problem of small samples that you quote was mentioned as an example of what challenges researchers face today, but certainly does not imply the authors believe "the data are inconclusive," as you say. In fact, the authors write that "the basic finding that income is moderately heritable has now been repeatedly replicated in a variety of samples, including nontwin samples (Rowe et al. 1999, Björklund et al. 2005)." In addition, one of the main findings of the paper is that permanent income (i.e., income averaged over 20 years) is even more heritable than income. I'm afraid you could hardly be more wrong. — Preceding unsigned comment added by 71.61.176.11 (talk) 23:39, 7 March 2015 (UTC)
- If you want to make claims about evidence from human biology, then WP:MEDRS applies. Can you find a recent but more than three year old peer reviewed literature review which is cited favorably in subsequent peer reviewed publications, that supports what you want to include? Here's an alternative hypothesis: "When income inequality changes, public opinion 'habituates' by adjusting expectations for fair levels of inequality in the same direction as the factual change. This adjustment effect occurs because humans are subject to status quo bias and have a motivated tendency to believe in a just world. In the context of increasing inequality in developed democracies over the last 40 years, the implication is that normative expectations for appropriate levels of inequality have adjusted up." — Trump, Kris-Stella (May 2, 2013). The Status Quo and Perceptions of Fairness: How Income Inequality Influences Public Opinion (PDF). Boston, Massachusetts: Harvard University. Retrieved 9 March 2015. EllenCT (talk) 13:40, 10 March 2015 (UTC)
- Alternatively, how do you feel about describing median wealth by race and income? Or access to birth control? EllenCT (talk) 23:33, 10 March 2015 (UTC)
- I fully agree with EllenCT's comments.
- In addition, see this:
- "The history of biology is littered with horrifying examples of the misuse of genetics (and evolutionary theory) to justify power and inequality: evolutionary justifications for slavery and colonialism, scientific explanations for rape and patriarchy, and genetic explanations for the inherent superiority of the ruling elite." -Pankaj Mehta, There's a gene for that (February 2014), Jacobin.
- The following article by Jonathan Latham, a Ph.D. scientist: Political Paralysis and the Genetics Agenda (August 2013), CounterPunch.
- Additional recommended reading:
- IjonTichy (talk) 16:36, 13 March 2015 (UTC)
- As an uninvolved bystander, this seems unnecessarily aggressive and biased. I don't see the relevance of Nazi eugenics to the discussion which is about (?) the factuality of a claim and the reputability of a particular source. I could use "Horrible 1 used 2 to justify the horrible 3, so clearly 2 is incorrect" against pretty much anything (e.g. "France used protecting women to justify their colonialism, so clearly we shouldn't defend girls against the Taliban"). — Preceding unsigned comment added by 173.79.36.184 (talk) 05:15, 20 March 2015 (UTC)
Charitable Giving
Ken Stern's Atlantic article "Why the Rich Don't Give to Charity" is cited here for its claim that the top 20% of income earners donate only 1.3% of income to charity, but Stern's article itself provides no source for the claim. I came across this page while attempting to find a source, and have thus far come up empty-handed. Every reference I can find that includes this claim cites only the Stern article. I've found multiple other sources suggesting that the figure is too low (not to mention that the top quintile is not what most people have in mind when they hear "richest Americans.")
For example, this report from the Urban Institute shows a U-shaped curve bottoming out at 2.4%, nearly twice the rate Stern claims, for the very same year. It also shows that those with incomes over $10 million give at the highest rate. Note that these the U-shaped curve is largely an artifact of the fact that the data are based only on itemized returns, and the vast majority of low-income earners do not itemize. Those who do are not necessarily representative in this respect, and thus should not be taken as support of Stern's claim that the poor give more. The numbers are more reliable at incomes of $100k-$200k, where 84% of returns are itemized, and especially above $200k, where 95% or more of returns are itemized (The TPC doesn't provide a source for the chart of itemization rates, but the same data are available from the IRS in table 1.2 here. This study from researchers at Boston College's Center on Wealth and Philanthropy explains this phenomenon in greater detail, albeit with older data.
Edit: Removed a claim about the Consumer Expenditure Survey, as it was based on my misreading the table. The criticism of this section stands without it, though.
In short, the whole section on charitable giving is based on an unsourced claim that conflicts with more reliable sources, and should be removed. — Preceding unsigned comment added by 110.5.39.245 (talk) 15:53, 8 April 2015 (UTC)
- So if we have a better source, we should use it, and conform the writing to capture that. Since the Atlantic is a reliable source, there's nothing stopping another editor from just putting it back is as it was. We may find ourselves ultimately with a dueling paragraph that acknowledges different views on the topic. I do agree that top quintile is almost never use in discussions of income inequality given that captures people with professions with so lofty pay as high-school teacher. Mattnad (talk) 16:30, 10 April 2015 (UTC)
Inequality myths
http://www.cato.org/publications/commentary/inequality-myths
http://fortune.com/2015/03/02/economic-inequality-myth-1-percent-wealth/
http://www.forbes.com/sites/jeffreydorfman/2014/05/08/dispelling-myths-about-income-inequality/
http://www.forbes.com/sites/johngoodman/2014/01/02/the-five-biggest-myths-about-income-inequality/
http://www.cnbc.com/id/101367332
http://www.thefiscaltimes.com/2015/02/24/Incessant-Myth-Growing-Wealth-Gap
http://www.economist.com/blogs/democracyinamerica/2010/09/inequality
http://www.brookings.edu/research/opinions/2014/01/06-income-gains-and-inequality-burtless Phmoreno (talk) 02:24, 10 July 2015 (UTC)
Misleading graph

This graph ignores the fact that the average family shrank in size (with a sharp rise in single parent households), that total compensation including benefits more closely tracks productivity than wages and that government transfer payments increased. After compensating for these factors average family income rose by over a third during the period.
This graph is a misrepresentation of the facts. See Inequality myths above plus:
http://www.wsj.com/articles/SB10001424052702303603904579493612156024266
I will post a link to the St. Louis Fed paper showing productivity versus total compenastion.Phmoreno (talk) 02:37, 10 July 2015 (UTC)
- From the above opinion piece:
In the past four years, our two academic professional organizations—the American Political Science Association and the American Educational Research Association—have each dedicated annual meetings to inequality, with numerous papers and speeches denouncing free markets, the decline of unions, and "neoliberalism" generally as exacerbating economic inequality. Yet our searches of the groups' conference websites fail to turn up a single paper or panel addressing the effects of family change on inequality.
- So apparently inequality does exist, but according to this reactionary screed, it's not neoliberal economic policies which have caused it, but merely the effects of family change (i.e., unwed mothers). This is reminiscent of the vile hate-filled propaganda spewed forth on O'Reilly night after night. Funny thing is, the very proponents of market forces such as the OECD and the IMF are saying pretty much the same thing all those papers and speeches are. The IMF in particular, which is part of the "troika" that has imposed the harshest austerity measures on the Greek people over the last five years, has reputiated trickle down theory as an absolute fraud and blamed it along with the decline of unions for the *unprecedented* levels of inequality in the United States and other advanced economies today. Not only that, but statistics show that the highest unwed birth rates are in the Scandinavian countries, which are some of the most egalitarian on earth and have high rates of social mobility - renowned economist Joseph Stiglitz commented that these nations are greater lands of opportunity than the US today, and suggested renaming the American dream the Scandinavian dream. These nations also have powerful unions and highly unionized working populations, imagine that? Well, there goes that right-wing talking point that it's merely unwed mothers who are responsible for this problem which reactionaries prefer to deny exists, unless they can blame it all on the people they hate.
- Almost all of the other links you posted above are also cherry-picked libertarian/right-wing blogs, think tanks and opinion pieces with their own agendas. The Cato Institute is a corporate-funded libertarian think tank founded by billionaire oligarch Charles Koch, and The Economist is rather notorious for its market fundamentalist views - just recently embarrassed and forced to retract a much-pilloried "review" of Edward E. Baptist's groundbreaking book on American slavery and capitalism because the anonymous reviewer was insistent on giving the benefit of the doubt to brutal capitalist slave owners.
- Much like the insane denial of man-made climate change, to deny the existence of widening wealth and income disparity, especially in the United States where it is so apparent, and ignore the plethora of evidence which makes the case for what is causing it is to stick one's head in the sand to live in a fantasy world, a world where unwed mothers are the villains and greedy multinationals and their bought politicians who have stripped working people of their economic power are apparently blameless.--C.J. Griffin (talk) 03:25, 10 July 2015 (UTC)
- All of that tirade and not one point of the referenced articles was addressed. So are you disagreeing with the fact that total compensation, which includes benefits, does not more closely track productivity than wages? Or are you denying that the size of the average American family has not gotten smaller and is composed of more single parent households? Or are you questioning whether government transfers payments, which are not included in "income" have not increased? There are references that support these facts.Phmoreno (talk) 14:21, 10 July 2015 (UTC)
- <INSERT>Are you kidding me? I actually quoted the one article and systematically took apart the argument it made, with reliable sources.--C.J. Griffin (talk) 17:22, 10 July 2015 (UTC)
- That was the most bizarre analysis I have seen here yet. Everything from austerity and the Greek people to the IMF, but I fail to see how your so called references have anything to do with the actual facts at issue.
- <INSERT>Are you kidding me? I actually quoted the one article and systematically took apart the argument it made, with reliable sources.--C.J. Griffin (talk) 17:22, 10 July 2015 (UTC)
- All of that tirade and not one point of the referenced articles was addressed. So are you disagreeing with the fact that total compensation, which includes benefits, does not more closely track productivity than wages? Or are you denying that the size of the average American family has not gotten smaller and is composed of more single parent households? Or are you questioning whether government transfers payments, which are not included in "income" have not increased? There are references that support these facts.Phmoreno (talk) 14:21, 10 July 2015 (UTC)
Did the average family size shrink or not? Is it reasonable to expect two parent households to have a lot more income than single parent households? I have another paper by the Census Bureau saying it did and that there was a sharp rise in single parent households.Phmoreno (talk) 03:09, 11 July 2015 (UTC)
- Do I have to spell it out for you? The OECD and the IMF published reports just this year that largely corroborate those numerous reports and speeches decried by the author of that WSJ article. This is significant as it shows even neoliberal institutions and organizations are now attributing rising inequality to trickle-down economics, union busting and stagnant wages, not single mothers.--C.J. Griffin (talk) 04:31, 11 July 2015 (UTC)
St. Louis Federal Reserve: https://research.stlouisfed.org/publications/es/07/ES0707.pdf Productivity closely tracks total compensation per hour
- ILO (December 2014, pertains to developed economies): http://www.ilo.org/global/research/global-reports/global-wage-report/2014/Charts/WCMS_322713/lang--en/index.htm
- 2015 article in The Atlantic: http://www.theatlantic.com/business/archive/2015/02/why-the-gap-between-worker-pay-and-productivity-is-so-problematic/385931/
- --C.J. Griffin (talk) 16:04, 10 July 2015 (UTC)
- Your reply did not address a single point at issue. The paper on developed countries is irrelevant to an article about the United States and does does not address any point in the critical articles listed above or in the data from the Congressional Budget Office, Census Bureau or the St. Louis Fed. The Atlantic article is just a commentary on the evils of the supposedly widening productivity-compensation gap that hid all the facts brought out by several commentators. You should have included Hillary Clinton, who used this same misleading graph in a speech yesterday without revealing that it was misleading (For the record the graph was shown on Fox News around 12:30 EDT Jly 8).Phmoreno (talk) 17:27, 10 July 2015 (UTC)
- The United States is a developed country, so it is included in the ILO's analysis. You wish to dismiss it because it contradicts your outdated St louis Fed article from before the recession (the graph it supposedly contradicts goes to 2011 - and that little addition you added at the bottom should NOT find its way into the article), as does the Atlantic interview with Jan W. Rivkin, an economist and senior-associate dean for research at Harvard Business School, which you baselessly claim "hid all the facts brought out by several commentators." Another comprehensive and more up-to-date (2015) analysis can be found here: Wage Stagnation in Nine Charts. Oh, and Fox News....LOL!--C.J. Griffin (talk) 04:31, 11 July 2015 (UTC)
- Your reply did not address a single point at issue. The paper on developed countries is irrelevant to an article about the United States and does does not address any point in the critical articles listed above or in the data from the Congressional Budget Office, Census Bureau or the St. Louis Fed. The Atlantic article is just a commentary on the evils of the supposedly widening productivity-compensation gap that hid all the facts brought out by several commentators. You should have included Hillary Clinton, who used this same misleading graph in a speech yesterday without revealing that it was misleading (For the record the graph was shown on Fox News around 12:30 EDT Jly 8).Phmoreno (talk) 17:27, 10 July 2015 (UTC)
"Economists long have noted that focusing on AHE (average hourly earnings) rather than total compensation yields an inaccurate picture of labor compensation due to the omission from AHE of employer-provided benefits." https://research.stlouisfed.org/publications/es/07/ES0707.pdf
Phmoreno (talk) 02:16, 12 July 2015 (UTC)
According Fig. 8 Wage Stagnation in Nine Charts the Real average hourly wage of production/nonsupervisory workers in the private sector in 2014 was $10.89. According to the St. Louis Fed it was $20.59 in June 2014. Again, benefits are not included.Phmoreno (talk) 02:35, 12 July 2015 (UTC)
- You're obfuscating the issue with outdated sources and original research. Chart 2 of the EPI article is nearly identical to the one you posted above. The chart does not ignore total compensation as you alleged. From the article:
Note: Data are for compensation (wages and benefits) of production/nonsupervisory workers in the private sector and net productivity of the total economy. "Net productivity" is the growth of output of goods and services less depreciation per hour worked. Source: EPI analysis of Bureau of Labor Statistics and Bureau of Economic Analysis data (emphasis mine)
--C.J. Griffin (talk) 03:09, 12 July 2015 (UTC)
- I should have been clearer. With the St. Louis Fed quote I was referring to the original chart, top right, that is the subject of this section. All of the criticisms of that chart still stand. I am not saying inequality hasn't increased, but the graph in question has several problems. It needs to be replaced with one that is more appropriate.Phmoreno (talk) 03:31, 12 July 2015 (UTC)
Regarding Fig. 2 of EPI article: If you look at the data you will find that the lines on the chart do not correspond with the data in the table, but are reversed. According to the table productivity is up 109% while hourly compensation is up 243%. However, the graph is probably correct. It's just disturbing that is the second mistake I found in this paper. Phmoreno (talk) 12:30, 12 July 2015 (UTC)
Decline in union membership as a leading "cause" of inequality
The neoclassical view is that income distribution is the result of the marginal value added by various classes of labor, and between labor and capital. The globalization hypothesis is consistent with this view, as are the skills and superstar theories. (Hopefully I can find a paper I was reading earlier today that said globalization was a major factor in the increase in inequality.) The percent of the labor force working in heavily unionized manufacturing was 30% after WWII, and is about 10% now. This decline in union membership was roughly proportional to the decline in manufacturing's share. A huge drop in manufacturing's share of employment happened ca. 2000, the same time as Asian imports started their big increase and the tech bubble was brewing.Phmoreno (talk) 22:19, 12 July 2015 (UTC)
- The IMF's analysis undermines the accepted wisdom that lower union membership affects chiefly low- and moderate-income workers. The fund's analysts, Florence Jaumotte and Carolina Osorio Buitron, find instead that the impact of declining unionization is felt across the entire income spectrum. The trend not only reduces the welfare of the lower income worker, they find; it makes the rich richer: "The decline in unionization," they write, "appears to be a key contributor to the rise of top income shares." - From the LA Times article: IMF agrees: Decline of union power has increased income inequality (emphasis mine).--C.J. Griffin (talk) 23:28, 12 July 2015 (UTC)
- No, it's not the decline of unions, its the decline of high paying jobs in traditionally unionized industries. In internationally traded goods the unions do not ultimately determine wages, it's the people making $1.50 per day working 10-12 hours in sweatshops who do. It's also robots, who work 24/7, 360 days per year, never needing a break for lunch or the bathroom, requiring no wages or health insurance, never going on strike and not protected by OSHA and other regulatory programs (think paint spraying of autos). Many robots can pay for themselves in a few months. Unions are becoming increasingly irrelevant and it's going to get worse. The best analogy I can give you is to consider the introduction of the internal combustion engine: How much effect would they have had if the interests who owned or managed horses had formed a union and tried to stabilize the rates for horses?
Phmoreno (talk) 23:53, 12 July 2015 (UTC)
- An interesting read and food for thought: The Box about container shipping, a really interesting book. Containerization eliminated hundreds of thousands of jobs, not just in ports but also in warehousing and trucking. A larger ship can be loaded or unloaded in less than a day, compared to a week previously. This brought down prices and made it inexpensive to ship goods internationally. A pair of jeans (possibly made by a subsistence worker in a third world sweatshop) can now be shipped anywhere in the world for less than ten cents. The relatively few remaining jobs handling containers in ports can pay $100,000 or more annually.Phmoreno (talk) 03:00, 13 July 2015 (UTC)
- Well thankfully we go by what WP:RS say, not what User:Phmoreno says. It should be noted that the Scandinavian countries have some of the highest wages in the world, very low levels of income inequality and also rank highest in the world for workers rights. Why? Because they have highly unionized workforces. However, they also participate in globalization and offshoring much like other advanced economies. According to sociologist Jake Rosenfeld of the University of Washington and author of What Unions No Longer Do (Harvard University Press, 2014):
- An interesting read and food for thought: The Box about container shipping, a really interesting book. Containerization eliminated hundreds of thousands of jobs, not just in ports but also in warehousing and trucking. A larger ship can be loaded or unloaded in less than a day, compared to a week previously. This brought down prices and made it inexpensive to ship goods internationally. A pair of jeans (possibly made by a subsistence worker in a third world sweatshop) can now be shipped anywhere in the world for less than ten cents. The relatively few remaining jobs handling containers in ports can pay $100,000 or more annually.Phmoreno (talk) 03:00, 13 July 2015 (UTC)
"Much has been made about the importance of globalization, technological change, and the resulting premium on highly educated workers as the primary contributors to our current inequality levels. It’s crucial to emphasize, however, that America didn’t experience technological change and globalization alone – so did the rest of the industrialized world. Yet these countries are not experiencing the same steep rise in inequality that we have. A major culprit is the difference in unionization rates. Canada has a unionization rate two to three times that of our own and lower inequality. European countries like Norway and Sweden have much lower inequality and organization rates well above 50 percent. Supporters of organized labor should do much more to connect the issue of growing inequality in this country to the desperate plight of the labor movement. The historical pattern is clear; the cross-national pattern is clear: high inequality goes hand-in-hand with weak labor movements and vice-versa."
--C.J. Griffin (talk) 03:21, 13 July 2015 (UTC)
- You believe a junior (non-tenured) sociologist specializing in union issues at U of Wash has the best understanding of this issue, better than economists? I suggests that there are multiple assesments of the issue and this one is heterogenous. Capitalismojo (talk) 21:42, 15 July 2015 (UTC)
- I never said anything about Rosenfeld having the "best" understanding of the issue, but his analysis corroborates the conclusions of IMF economists Florence Jaumotte and Carolina Osorio Buitron, that the decline of unionization has been a significant driver of inequality since the 1980s.--C.J. Griffin (talk) 03:22, 16 July 2015 (UTC)
- Given the complexities of any economy, it would be overstating it to give the decline of unionization the "leading" factor, but there's plenty of literature out there that it's a contributing factor. Even globalization, certainly a cause of average wage declines here in the US (the workers in China on the other hand have benefited with wage increases), was preceded by a decline in worker protections which permitted companies to offshore the work. When studies are done of worker salaries and benefits in similar companies, those with unions and those without, the unionized employees are compensated better and have more job protections. As for the Canadian comparison, Canada also has a different government benefit approach which also narrows the gaps between the top and bottom, so it's not necessarily unions alone that account for the difference.Mattnad (talk) 13:15, 16 July 2015 (UTC)
- No one has said that the decline of unionization has been the leading factor in rising inequality, but a significant driver of it. Ergo, it is one of the leading factors. As such, it should not be arbitrarily moved to the bottom of the pack for political reasons, which is what started this discussion in the first place (or my reverting of it to the current, long-standing version). Again, even the IMF, which has imposed neoliberalism around the world through "structural adjustment" programs, agrees that it is a "key contributor" to rising inequality, and especially the rise of top income shares.--C.J. Griffin (talk) 01:53, 17 July 2015 (UTC)
- Given the complexities of any economy, it would be overstating it to give the decline of unionization the "leading" factor, but there's plenty of literature out there that it's a contributing factor. Even globalization, certainly a cause of average wage declines here in the US (the workers in China on the other hand have benefited with wage increases), was preceded by a decline in worker protections which permitted companies to offshore the work. When studies are done of worker salaries and benefits in similar companies, those with unions and those without, the unionized employees are compensated better and have more job protections. As for the Canadian comparison, Canada also has a different government benefit approach which also narrows the gaps between the top and bottom, so it's not necessarily unions alone that account for the difference.Mattnad (talk) 13:15, 16 July 2015 (UTC)
- I never said anything about Rosenfeld having the "best" understanding of the issue, but his analysis corroborates the conclusions of IMF economists Florence Jaumotte and Carolina Osorio Buitron, that the decline of unionization has been a significant driver of inequality since the 1980s.--C.J. Griffin (talk) 03:22, 16 July 2015 (UTC)
- You believe a junior (non-tenured) sociologist specializing in union issues at U of Wash has the best understanding of this issue, better than economists? I suggests that there are multiple assesments of the issue and this one is heterogenous. Capitalismojo (talk) 21:42, 15 July 2015 (UTC)
Structural change: Due to deindustrialization, large corporations have been net job losers while small business (think services) have been creating the new jobs. A large factory or oil refinery cannot fire several hundred to a few thousand people and expect to hire replacements capable of running the operation, but if everyone at your local fast food restaurant or motel goes on strike it's not hard to replace them. (The owners would do it quickly or go broke.)Phmoreno (talk) 03:01, 17 July 2015 (UTC)
- Speaking of fast food workers...--C.J. Griffin (talk) 04:16, 17 July 2015 (UTC)
- Perhaps that is a better alternative to having young people go into debt to get useless degrees and then get a job making considerably less than Danish food workers. The last hamburger I purchased in the EU was at the Zurich airport over 20 years ago and it cost $10. My guess is that people don't eat out much. No wonder the unemployment rate in the EU is so high.Phmoreno (talk) 11:13, 17 July 2015 (UTC)
Good luck to unions trying to raise wages:
In Dongguan City, located in the central Guangdong province of China, a technology company has set up a factory run almost exclusively by robots, and the results are fascinating.[4]
Phmoreno (talk) 23:39, 1 August 2015 (UTC)
External links modified
Hello fellow Wikipedians,
I have just added archive links to one external link on Income inequality in the United States. Please take a moment to review my edit. If necessary, add {{cbignore}} after the link to keep me from modifying it. Alternatively, you can add {{nobots|deny=InternetArchiveBot}} to keep me off the page altogether. I made the following changes:
- Added archive https://web.archive.org/20120205101233/http://stats.oecd.org/Index.aspx?QueryId=26068 to http://stats.oecd.org/Index.aspx?QueryId=26068
When you have finished reviewing my changes, please set the checked parameter below to true to let others know.
This message was posted before February 2018. After February 2018, "External links modified" talk page sections are no longer generated or monitored by InternetArchiveBot. No special action is required regarding these talk page notices, other than regular verification using the archive tool instructions below. Editors have permission to delete these "External links modified" talk page sections if they want to de-clutter talk pages, but see the RfC before doing mass systematic removals. This message is updated dynamically through the template {{source check}} (last update: 18 January 2022).
- If you have discovered URLs which were erroneously considered dead by the bot, you can report them with this tool.
- If you found an error with any archives or the URLs themselves, you can fix them with this tool.
Cheers.—cyberbot IITalk to my owner:Online 01:21, 21 January 2016 (UTC)
Decline in employment to population ratio may account for most of the decline in median family income
People who retire from their long time careers and who seek reemployment usually earn considerably less if they continue to work and will have even less income if they fully retire. These factors can explain most of the decline in median household income. (Retraction: The age group 65 + is doing better than others others post 2008. That leaves the decline in the employment to population ratio as the main cause.)
http://bonddad.blogspot.com/2013/08/the-truth-about-decline-in-real-median.htmlPhmoreno (talk) 12:55, 29 May 2016 (UTC)
- It's not a reliable source, but there's probably one out there. I don't know why more people haven't pointed this out.Phmoreno (talk) 18:12, 29 May 2016 (UTC)
- An interesting hypothesis, but it seems refuted here. Some good charts with median real wages by age group. Older folks doing quite well even in retirement, as Social Security kicks in.[Advisor Perspectives]Farcaster (talk) 00:22, 30 May 2016 (UTC)
- Here is a FRED chart with some of the pertinent variables. You can download and check correlation. [FRED - Real Median Wages and Various Employment Ratios]Farcaster (talk) 00:33, 30 May 2016 (UTC)
- There certainly is a long-term decline in LFPR, about half due to aging / demographics and the other cyclical (amount varies by source). The demographic part has been predicted for a long time; the cyclical part was affected by the crisis. More people have left the workforce due to retirement, more on disability and more kids in school are key factors behind the LFPR decline (see this LFPR changes) How that ties to lower median household income is unclear. Wages are driven by supply and demand. We have substitutes now in Asia for our workforce at much lower prices, so the price has fallen. Robots are increasingly a substitute, although economists debate whether automation creates more or fewer jobs overall. We've got far fewer in unions, reducing labor bargaining power vs. capital (there is a long-term trend of more share of GDP going to capital). We've got a higher share of part-time vs. full time jobs in the workforce and we're trading higher paying manufacturing and construction jobs for lower paying service jobs. So the mix of jobs matters as well. Unfortunately, the BLS recently projected that most of the jobs to be added in the next 10 years are low-paying jobs mainly in healthcare (home caregivers for the elderly at low wages). So while the variables are lightly correlated (0.5 for the E-M ratio for the 25-54 age group with real household median wages, less for the other variables) the causes are deeper. The article on Unemployment in the United States covers some of this as well.Farcaster (talk) 16:20, 30 May 2016 (UTC)
- From a supply and demand perspective, I should add that if the labor force participation rate is declining (i.e., more folks outside the labor force) that should actually help wages (less supply), as opposed to a situation where it was increasing. As I mentioned above, labor supply is more global now. The U.S. has created few or no jobs in internationally tradable goods sectors; nearly all the jobs are in non-tradable sectors (services) that are tougher to offshore.Farcaster (talk) 16:39, 30 May 2016 (UTC)
- Farcaster, your statement is quite accurate. I would only add we are in a depression with unemployment masked by the change to U3 instead of U6 as the official unemployment rate [5] plus government transfer payments. Low wage countries producing internationally tradable goods is one of the reasons for the collapse in domestic investment.Phmoreno (talk) 17:03, 30 May 2016 (UTC)
- I agree with your last sentence. However, U3 and U6 have been around for awhile. Here is a chart showing them over time. Not that bad. FRED-U3 and U6. We have more part-time jobs and lower paying jobs, a bigger problem than a low U3 and slightly elevated U6. Don't let all the negativity in the election cycle bring you down; opposition parties are supposed to do that!Farcaster (talk) 03:31, 31 May 2016 (UTC)
Proposed inclusions
"Low and middle incomes have fallen, and the top 10% of income earners have obtained almost all of the income gains in the recovery, with most of the gains going to the top 1% and the top 0.01% gaining as much as the bottom _% lost, because wage increases have not been linked to productivity gains, and because of a lack of pay equity and a lack of an employment safety net at living wages;[1] instead, incomes have diverged and inequalities have widened.[2][3]" Also, I would like to see this graph for the US instead of China, along with Herzer and Vollmer (2013) and Baumol (2007) supporting a sentence summarizing the overlapping portion of their abstracts in the economic growth section. EllenCT (talk) 14:51, 25 April 2015 (UTC)
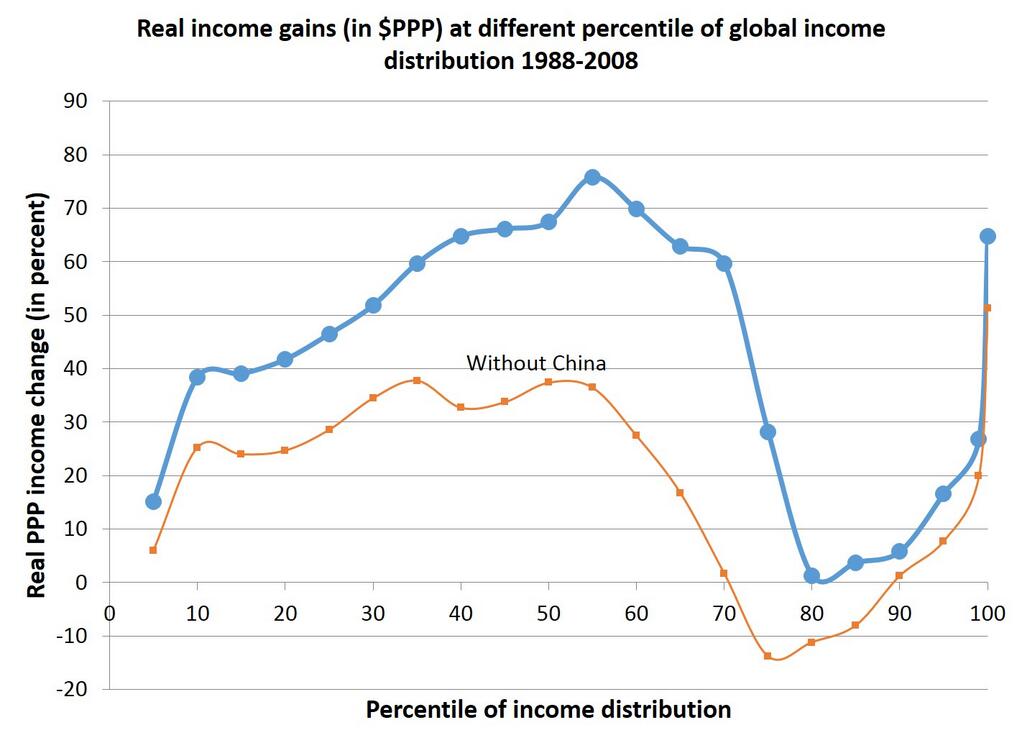
References
- ^ Tcherneva, Pavlina R. (April 2015). "When a rising tide sinks most boats: trends in US income inequality" (PDF). levyinstitute.org. Levy Economics Institute of Bard College. Retrieved 10 April 2015.
- ^ Casselman, Ben (September 22, 2014). "The American Middle Class Hasn't Gotten A Raise In 15 Years". FiveThirtyEightEconomics. Retrieved 23 April 2015.
- ^ Parlapiano, Alicia; Gebeloff, Robert; Carter, Shan (January 26, 2013). "The Shrinking American Middle Class". The Upshot. New York Times. Retrieved 23 April 2015.
- I support the proposed inclusions.--C.J. Griffin (talk) 03:33, 26 April 2015 (UTC)
- I agree with everything EllenCT says.Farcaster (talk) 19:21, 26 April 2015 (UTC)
- Wow, thanks both. Let me also suggest some Owen Zidar, e.g., "the positive relationship between tax cuts and employment growth is largely driven by tax cuts for lower-income groups and that the effect of tax cuts for the top 10% on employment growth is small." (Zidar, Owen. "Tax Cuts For Whom? Heterogeneous Effects of Income" (PDF). Retrieved 27 April 2015.
{{cite journal}}: Cite journal requires|journal=(help)) EllenCT (talk) 01:47, 27 April 2015 (UTC)
- Wow, thanks both. Let me also suggest some Owen Zidar, e.g., "the positive relationship between tax cuts and employment growth is largely driven by tax cuts for lower-income groups and that the effect of tax cuts for the top 10% on employment growth is small." (Zidar, Owen. "Tax Cuts For Whom? Heterogeneous Effects of Income" (PDF). Retrieved 27 April 2015.
What about economic inequality in early America? Or while the 13 states were still Colonies? The article currently begins historical overview at the civil war (1860's). — Preceding unsigned comment added by 104.193.232.47 (talk) 13:24, 27 April 2017 (UTC)
The real reason we are hearing of income inequality now
The divergence of productivity and total compensation started in the 1970s (when deinsustrialization was beginning and married women began entering the workforce in a larger proportion) and the gap has been narrowing since the early 1990s. From 2000-2010 after tax income went up significantly (15-20%) for the bottom quintiles and down for the top of the income distribution. That made me wonder why income inequality suddenly became such an issue. Then when I saw the graph based on CBO date showing that all tax revenues would go to entitlements by 2030 it made perfect sense:
http://www.zerohedge.com/news/2015-07-16/how-likely-hyperinflation-us
External links modified
Hello fellow Wikipedians,
I have just modified one external link on Income inequality in the United States. Please take a moment to review my edit. If you have any questions, or need the bot to ignore the links, or the page altogether, please visit this simple FaQ for additional information. I made the following changes:
- Added archive http://web.archive.org/web/20140812211534/http://www.washingtonmonthly.com/features/2010/1003.lynn-longman.html to http://www.washingtonmonthly.com/features/2010/1003.lynn-longman.html
When you have finished reviewing my changes, please set the checked parameter below to true or failed to let others know (documentation at {{Sourcecheck}}).
This message was posted before February 2018. After February 2018, "External links modified" talk page sections are no longer generated or monitored by InternetArchiveBot. No special action is required regarding these talk page notices, other than regular verification using the archive tool instructions below. Editors have permission to delete these "External links modified" talk page sections if they want to de-clutter talk pages, but see the RfC before doing mass systematic removals. This message is updated dynamically through the template {{source check}} (last update: 18 January 2022).
- If you have discovered URLs which were erroneously considered dead by the bot, you can report them with this tool.
- If you found an error with any archives or the URLs themselves, you can fix them with this tool.
Cheers.—InternetArchiveBot (Report bug) 07:14, 21 July 2016 (UTC)
reverted incorrect grammar fix
IP 76.184.196.195 changed "1970s" to "1970's", reportedly to "fix grammar".
The "s" in "1970s" is plural -- not just one year but the group of years beginning 1970.
The "s" in "1970's" would either be possessive or a contraction: Possessive would not make sense, because the following word is a preposition "after", and 1970 cannot own "after". If a contraction, then the three word sequence "the 1970's after" should be equivalent to "the 1970 is after". That does not make sense, either.
I appreciate the effort of the anonymous editor, but s/he seems misguided in this. DavidMCEddy (talk) 04:54, 22 February 2017 (UTC)
External links modified
Hello fellow Wikipedians,
I have just modified 3 external links on Income inequality in the United States. Please take a moment to review my edit. If you have any questions, or need the bot to ignore the links, or the page altogether, please visit this simple FaQ for additional information. I made the following changes:
- Added archive https://web.archive.org/web/20070616152316/https://www.brookings.edu/views/papers/burtless/20070111.htm to http://www.brookings.edu/views/papers/burtless/20070111.htm
- Added archive https://web.archive.org/web/20070714000042/http://www.commondreams.org/headlines05/0605-01.htm to http://www.commondreams.org/headlines05/0605-01.htm
- Added archive https://web.archive.org/web/20130113032210/http://www.argentumlux.org/documents/JEL_6.pdf to http://www.argentumlux.org/documents/JEL_6.pdf
When you have finished reviewing my changes, you may follow the instructions on the template below to fix any issues with the URLs.
This message was posted before February 2018. After February 2018, "External links modified" talk page sections are no longer generated or monitored by InternetArchiveBot. No special action is required regarding these talk page notices, other than regular verification using the archive tool instructions below. Editors have permission to delete these "External links modified" talk page sections if they want to de-clutter talk pages, but see the RfC before doing mass systematic removals. This message is updated dynamically through the template {{source check}} (last update: 18 January 2022).
- If you have discovered URLs which were erroneously considered dead by the bot, you can report them with this tool.
- If you found an error with any archives or the URLs themselves, you can fix them with this tool.
Cheers.—InternetArchiveBot (Report bug) 03:27, 10 April 2017 (UTC)
External links modified
Hello fellow Wikipedians,
I have just modified 7 external links on Income inequality in the United States. Please take a moment to review my edit. If you have any questions, or need the bot to ignore the links, or the page altogether, please visit this simple FaQ for additional information. I made the following changes:
- Added archive https://web.archive.org/web/20140211171400/http://blogs.lse.ac.uk/politicsandpolicy/archives/39215 to http://blogs.lse.ac.uk/politicsandpolicy/archives/39215
- Added archive https://web.archive.org/web/20121103174646/http://www.hoover.org/publications/defining-ideas/article/99241 to http://www.hoover.org/publications/defining-ideas/article/99241
- Added archive https://web.archive.org/web/20160304091537/http://www.princeton.edu/~bartels/economic.pdf to https://www.princeton.edu/~bartels/economic.pdf
- Added archive https://web.archive.org/web/20131522272100/http://www.gp.org/committees/platform/2010/economic-justice.php to http://www.gp.org/committees/platform/2010/economic-justice.php
- Added archive https://web.archive.org/web/20070626072233/http://pubdb3.census.gov/macro/032006/hhinc/new01_001.htm to http://pubdb3.census.gov/macro/032006/hhinc/new01_001.htm
- Added archive https://web.archive.org/web/20150206200556/http://ineteconomics.org/research-programs/political-economy-distribution/papers/wage-increases-transfers-and-socially-determ to http://ineteconomics.org/research-programs/political-economy-distribution/papers/wage-increases-transfers-and-socially-determ
- Added archive https://web.archive.org/web/20150206201923/http://ineteconomics.org/institute-blog/what-thomas-piketty-and-larry-summers-don-t-tell-you-about-income-inequality to http://ineteconomics.org/institute-blog/what-thomas-piketty-and-larry-summers-don-t-tell-you-about-income-inequality
When you have finished reviewing my changes, you may follow the instructions on the template below to fix any issues with the URLs.
This message was posted before February 2018. After February 2018, "External links modified" talk page sections are no longer generated or monitored by InternetArchiveBot. No special action is required regarding these talk page notices, other than regular verification using the archive tool instructions below. Editors have permission to delete these "External links modified" talk page sections if they want to de-clutter talk pages, but see the RfC before doing mass systematic removals. This message is updated dynamically through the template {{source check}} (last update: 18 January 2022).
- If you have discovered URLs which were erroneously considered dead by the bot, you can report them with this tool.
- If you found an error with any archives or the URLs themselves, you can fix them with this tool.
Cheers.—InternetArchiveBot (Report bug) 14:34, 12 May 2017 (UTC)
External links modified
Hello fellow Wikipedians,
I have just modified 7 external links on Income inequality in the United States. Please take a moment to review my edit. If you have any questions, or need the bot to ignore the links, or the page altogether, please visit this simple FaQ for additional information. I made the following changes:
- Added archive https://web.archive.org/web/20070627125108/http://www.princeton.edu/~bartels/income.pdf to http://www.princeton.edu/~bartels/income.pdf
- Added archive https://web.archive.org/web/20120910120437/http://blogs.independent.co.uk/2012/07/02/stiglitz-the-full-transcript/ to http://blogs.independent.co.uk/2012/07/02/stiglitz-the-full-transcript/
- Added archive https://web.archive.org/web/20110812071812/http://bdp.law.harvard.edu/pdfs/papers/Warren/Vanishing_Trials_JES.pdf to http://bdp.law.harvard.edu/pdfs/papers/Warren/Vanishing_Trials_JES.pdf
- Added archive https://web.archive.org/web/20081201193249/http://www.eurofound.europa.eu/areas/qualityoflife/eurlife/index.php?template=3&radioindic=158&idDomain=3 to http://www.eurofound.europa.eu/areas/qualityoflife/eurlife/index.php?template=3&radioindic=158&idDomain=3
- Added archive https://web.archive.org/web/20121212053411/http://articles.businessinsider.com/2012-01-12/europe/30618761_1_tax-evasion-tax-man-tax-revenue to http://articles.businessinsider.com/2012-01-12/europe/30618761_1_tax-evasion-tax-man-tax-revenue
- Added archive https://web.archive.org/web/20080706151209/http://www.u.arizona.edu/~lkenwor/sf99-poverty.htm to http://www.u.arizona.edu/~lkenwor/sf99-poverty.htm
- Added archive https://web.archive.org/web/20070613152949/http://www.heritage.org/Research/Taxes/bg1791.cfm to http://www.heritage.org/Research/Taxes/bg1791.cfm
When you have finished reviewing my changes, you may follow the instructions on the template below to fix any issues with the URLs.
This message was posted before February 2018. After February 2018, "External links modified" talk page sections are no longer generated or monitored by InternetArchiveBot. No special action is required regarding these talk page notices, other than regular verification using the archive tool instructions below. Editors have permission to delete these "External links modified" talk page sections if they want to de-clutter talk pages, but see the RfC before doing mass systematic removals. This message is updated dynamically through the template {{source check}} (last update: 18 January 2022).
- If you have discovered URLs which were erroneously considered dead by the bot, you can report them with this tool.
- If you found an error with any archives or the URLs themselves, you can fix them with this tool.
Cheers.—InternetArchiveBot (Report bug) 20:45, 12 November 2017 (UTC)
External links modified
Hello fellow Wikipedians,
I have just modified one external link on Income inequality in the United States. Please take a moment to review my edit. If you have any questions, or need the bot to ignore the links, or the page altogether, please visit this simple FaQ for additional information. I made the following changes:
- Added archive https://web.archive.org/web/20130408151547/http://www.brookings.edu/about/projects/bpea/latest-conference/2013-spring-permanent-inequality-panousi to http://www.brookings.edu/about/projects/bpea/latest-conference/2013-spring-permanent-inequality-panousi
- Added
{{dead link}}tag to https://economix.blogs.nytimes.com/2012/01/17/measuring-the-top-1-by-wealth-not-income/NYT-Measuring
When you have finished reviewing my changes, you may follow the instructions on the template below to fix any issues with the URLs.
This message was posted before February 2018. After February 2018, "External links modified" talk page sections are no longer generated or monitored by InternetArchiveBot. No special action is required regarding these talk page notices, other than regular verification using the archive tool instructions below. Editors have permission to delete these "External links modified" talk page sections if they want to de-clutter talk pages, but see the RfC before doing mass systematic removals. This message is updated dynamically through the template {{source check}} (last update: 18 January 2022).
- If you have discovered URLs which were erroneously considered dead by the bot, you can report them with this tool.
- If you found an error with any archives or the URLs themselves, you can fix them with this tool.
Cheers.—InternetArchiveBot (Report bug) 01:05, 21 November 2017 (UTC)
Bias in sections discussing real wages
I've marked a couple of sections discussing real wages as biased, they mostly argue that things have got worse for the average worker, and ignore the fact that real total compensation has roughly matched productivity gains.131.111.184.91 (talk) 03:22, 26 February 2018 (UTC)
- I have pointed out the fact that real total compensation has roughly matched productivity gains many times here and in other related articles. The source is a St. Louis Fed paper. I have also pointed out why using median family income is misleading- because of the great rise in single parent families, usually headed by the mother, which is almost a sure sign of poverty. This is just Marxist propaganda and has no business being on Wikipedia.Phmoreno (talk) 04:13, 26 February 2018 (UTC)
Productivity chart
I recently removed a chart of productivity and median family income that is being used to deceive people. Part of the problem is that the income measure uses a different set of economic statistics than the productivity measure and when an adjustment for these twor data series is made most of the difference disappears.[1]
'Feldstein concludes that two principal measurement mistakes have led some analysts to conclude that the rise in labor income has not kept up with the growth in productivity. The first is a focus on wages rather than total compensation: because of the rise in fringe benefits and other non-cash payments, wages have not risen as rapidly as total compensation. Feldstein feels it is important to compare the productivity rise with the increase in total compensation rather than the increase in the narrower measure of just wages and salaries." "The second measurement problem that Feldstein addresses is the way in which nominal output and nominal compensation are converted to real values before making the comparison. Although any consistent deflation of the two series of nominal values will show similar movements of productivity and compensation, Feldstein concludes that it is misleading to use two different deflators, one for measuring productivity and the other for measuring real compensation."
The other problem is that the composition of a family has changed over the decades with households being increasingly being headed by single mothers.[2] Overlooking one of these errors may be forgivable, but combining them is purposely misleading.Phmoreno (talk) 02:53, 4 March 2018 (UTC)
- I agree with the removal, although ideally we'd have some info on various measures of inequality and the potential pitfalls of different approaches.Volunteer Marek (talk) 06:32, 4 March 2018 (UTC)
- I disagree with the removal. EPI considers the chart highly relevant. If another economist disagrees, then post the commentary from that economist. Do not remove it because you don't like the result or want to believe what Feldstein says.Farcaster (talk) 16:12, 4 March 2018 (UTC)
- EPI is either ignorant of their errors purposely misleading. The St. Louis Fed says that people promoting this should know better and so does NBER. Because it is using economic statistics, we should trust those who understand the statistics, not those promoting falsehoods. There are several papers debunking this type of chart and other inequality claims.Phmoreno (talk) 16:20, 4 March 2018 (UTC)
- I disagree with the removal. EPI considers the chart highly relevant. If another economist disagrees, then post the commentary from that economist. Do not remove it because you don't like the result or want to believe what Feldstein says.Farcaster (talk) 16:12, 4 March 2018 (UTC)
- Even the BLS says the same thing EPI is saying in the excellent article below, which has some great charts we could include to support the point EPI is making. "This Beyond the Numbers article studies underlying trends over the 1987–2015 period in 183 industries that are driving some of the widening gap between labor productivity and compensation observed in the nonfarm business sector. Most of the industries studied had increases in both labor productivity and compensation over the period studied; however, compensation lagged behind productivity in most cases." It also has adjustments that Feldstein mentions.[3]Farcaster (talk) 16:39, 4 March 2018 (UTC)
- Here is a FRED chart we could use instead of the EPI chart if that source bothers you; it has productivity and real compensation per hour instead.[4]Farcaster (talk) 16:39, 4 March 2018 (UTC)
- Total compensation is the accurate way to measure what workers are receiving. One reason cash compensation has stagnated relatiave to total compensation is because companies are contributing more to health insurance and savings plans and workers have more paid leave. Here are a few more articles that show that total compensation tracks productivity.
[5][6][7][8]Phmoreno (talk) 01:01, 5 March 2018 (UTC)
- Krugman's explantion is that compensation, to the extent it's kept up, reflects more hours worked, with a stagnant rate of pay. EPI has also "debunked the debunkers" more or less reviewing Sherk's analysis (the subject of three of the links you gave). So put Krugman in the camp of this being a big problem.[9] I don't know how to replicate the EPI chart Krugman references with FRED; I'll give it a shot next weekend. Again, if you think the graph is misleading, add some text with the pro/con arguments. I think we probably should have a pay and productivity section; the graph isn't in the right place.Farcaster (talk) 03:36, 5 March 2018 (UTC)
I fail to see how anything you presented makes the EPI graph acceptable. "Median family income" is not an acceptable measure over long periods of time because the composition of "family" has changed. It is well known that single mother headed families have been on the rise and that they are low income. How about a graph of median family income in families where fathers are present?Phmoreno (talk) 13:44, 5 March 2018 (UTC)
- Nor have you presented anything that makes it unacceptable. It is a fact that EPI reported it. We have EPI on the Left and Heritage on the Right (Sherk's work is the basis for several of your links) making arguments that are very different. Heritage acknowledges a large difference, but then tries to use alternate inflation measures to lessen the difference. EPI doesn't think the inflation adjustment is particularly relevant. Krugman thinks there is a big difference because hours had to go up because compensation rates were stagnant, siding with EPI's conclusion. Fortunately, the BLS (our most impartial source) sides clearly with EPI. In other words, you lost the argument. If you want to put the EPI chart in a section about productivity and wages along with the Heritage commentary, go right ahead. But do not delete a factual graph and statements.Farcaster (talk) 14:28, 5 March 2018 (UTC)
You also haven't dismissed the issue of total compensation closely tracking productivity. Health insurance, retirement plan benefits and paid leave all have to be counted to honestly do a comparison.Phmoreno (talk) 14:47, 5 March 2018 (UTC)
- ^ Total Compensation Reflects Growth in Productivity, National Bureau of Economic Research
- ^ The American Family Today, Pew Research Center
- ^ BLS-Beyond the Numbers-Understanding the labor productivity and compensation gap-June 2017
- ^ FRED Chart-Productivity and Compensation
- ^ US Wages Have Been Rising Faster Than Productivity, Forbes
- ^ Has Worker Compensation Tracked Productivity?
- ^ Total Worker Compensation and Productivity since 1973
- ^ When you measure it properly, worker’s compensation is driven by productivity
- ^ Krugman-Productivity and Pay-September 2015
plot of income inequality
@Farcaster: Thanks for the addition of your new plot of "U.S. Real Before Tax Median Family Income 2001-2016". It's a very useful addition to this article.
Two questions:

median computed as the geometric mean of the 20th and 40th percentiles
{{citation}}: |access-date= requires |url= (help)) and the US Internal Revenue Service.(Piketty, Thomas; Saez, Emmanuel. Atkinson, A. B.; Piketty, Thomas (eds.). "Income Inequality in the United States, 1913-2002". Retrieved 2012-02-08. {{cite web}}: Unknown parameter |booktitle= ignored (help); Unknown parameter |editor2link= ignored (|editor-link2= suggested) (help)). There are systematic differences between these two sources, but the differences are small relative to the scale of this plot. (The differences between the Census and Internal Revenue Service Data can be seen most easily in the 95th percentile, present in both data sets. For more details see the help file for the "incomeInequality" data in the Ecdat package available from the Comprehensive R Archive Network (CRAN; see r-project.org).)}}- Have you considered plotting these same number on a log scale? I do this routinely with numbers that must be positive (like incomes) for multiple reasons. For one thing, growth at a constant percentage rate appear like a straight line on a log scale and like an exponential growth curve on a linear scale. Deviations from a straight line are instantly recognizable to a naive observer, while deviations from exponential growth cannot be judged visually by any human, I don't think. Second, it's easier to compare variability between the bottom line and the top in plots like this: Percentage variations may be more important to people in the bottom quintile than the top decile, but variations for the bottom quintile are visually suppressed by a plot like this. With your linear scale, a standard human eye can pretty much only see the variations in the top lines and the differences between the lines and none of the fluctuations in the bottom line. Third, numbers like are nearly always, in my experience closer to being log-normally distributed than normally distributed. It's far easier to tell the difference between systematic and random changes on a log scale than on a linear scale.
- Have you compared these numbers with those available from Thomas Piketty and Emmanuel Saez (2006) "Income Inequality in the United States, 1913-1998", Quarterly Journal of Economics, 118(1), 2003, 1-39, (Currently available updated to 2015 from https://eml.berkeley.edu/~saez) and Census F-1 data (from https://www.census.gov/data/tables/time-series/demo/income-poverty/historical-income-inequality.html)? See my plot of these numbers in the accompanying plot. This plot has not been updated in roughly 6.5 years. It hasn't been, because I have not found the time to do it.
Also, have you considered plotting the numbers relative to one another, e.g., with multiple lines starting at "1" or "0" for reference, similar to the accompanying plot of "Productivity and Real Median Family Income Growth 1947-2009"? As suggested by item "1" above, I believe this plot would be more informative if plotted with the numbers plotted as a ratio rather than a linear difference from their starting points. It's been a long-term task for me to update my plot comparing Piketty and Saez with the Census F-1 table in this form with also the GDP data (e.g., from Louis Johnston and Samuel H. Williamson (2011) "What Was the U.S. GDP Then?" MeasuringWorth, http://www.measuringworth.org/usgdp). For this, I think I might limit the plot to the bottom quantile, the median (which I computed as the geometric mean of the third and fourth quintiles from F-1), the growth in real GDP per capita from MeasuringWorth, and the top 99th, 99.5th, 99.9th, and 99.99th percentiles from Piketty and Saez. I'd use all those lines, at least in one version of this analysis, because I know the 99th percentile has NOT grown at the same rate as real GDP per capita, and the 99.99th percentile has. I haven't done this, but I believe that the 99.5th percentile has grown at the same rate as real GDP per capita -- and higher incomes have grown faster.
Again, thanks for this addition. DavidMCEddy (talk) 09:45, 3 April 2018 (UTC)
- Happy to help. It will take me some time to digest all you've said above but I will look into it. I'm going to be reviewing & updating budget stuff based on the CBO budget & economic outlook that will be released on Monday, but late April or May I should get back to this.Farcaster (talk) 03:03, 4 April 2018 (UTC)
- Sam Williamson, President of MeasuringWorth, wrote me, "The Historical Statistic of the United States is the best source of deficit and debt numbers. MeasuringWorth is the best for GDP." From what I know, he's correct. DavidMCEddy (talk) 23:05, 4 April 2018 (UTC)