User:Cryptic C62/Graphs
This page documents my attempt to study VisualEditor load times across multiple browsers.
Graphs[edit]
Findings[edit]
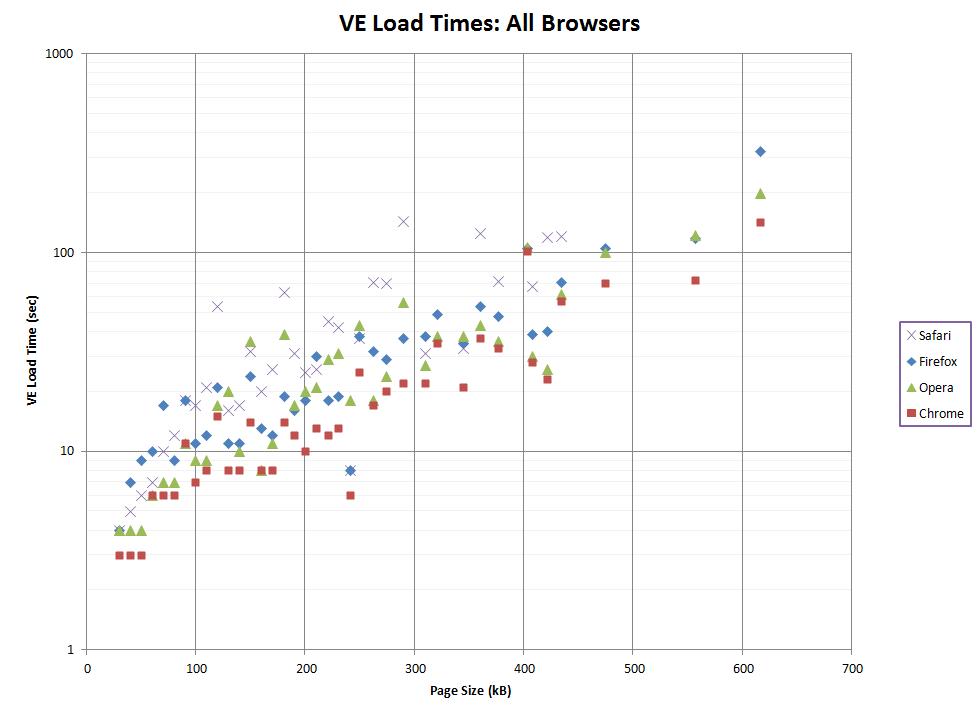
Of the browsers used, load times were consistently lower in Google Chrome. The dataset is incomplete for Safari; larger articles crashed the loader. From the models section below, it is not clear that any one growth model adequately describes all browsers. However, it seems clear that the growth is not linear or logarithmic, which would have been nice. Load times were also compared to file sizes and total image sizes (both found using User:Dr pda/prosesize), but no significant correlations were found in any browser.
Sampling[edit]
Special:LongPages was used to find articles. I started at the top of the list and worked my way down to History of Australia (262 kB), skipping some articles along the way. Then I worked down through the list to find one article near each multiple of 10 kB — 250 kB, 240 kB, 230 kB, etc.
Times[edit]
Models[edit]
Best fit highlighted in bold.
| Correlation Coefficients | ||||||
|---|---|---|---|---|---|---|
| Browser | Exponential | Polynomial Deg. 2 | Polynomial Deg. 3 | Power | Linear | Logarithmic |
| Safari | 0.6648 | 0.6014 | 0.6024 | 0.7327 | 0.5926 | 0.4894 |
| Firefox | 0.8440 | 0.8234 | 0.8933 | 0.7336 | 0.5761 | 0.3317 |
| Opera | 0.7988 | 0.8239 | 0.8693 | 0.8087 | 0.6745 | 0.4427 |
| Chrome | 0.8547 | 0.8111 | 0.8184 | 0.7935 | 0.6761 | 0.4321 |
Procedure[edit]
Open browser. Log in. Navigate to chosen article. Wait for it to completely load. Activate VisualEditor and start timer simultaneously. If any error messages appear, quickly click "continue", but do not stop timer. Find a cluster of wikilinks or transclusions in the article, and rapidly hover mouse across several of them. When VisualEditor recognizes hovering (blue underline for links, blue overlay for transclusions, green stripes for uneditables), stop timer. Note that this occurs after the VisualEditor toolbar appears. The idea is to see how long it takes before you can actually start editing, not how long it takes before loading appears to be finished.
Specs[edit]
- Skin: Vector
- Operating system: Windows Vista Home Premium
- Processor: Intel Premium Dual CPU E2180 @ 2.00 GHz
- RAM: 3.00 GB


