
User:Epipelagic/sandbox/ref1
| This is a Wikipedia user page. This is not an encyclopedia article or the talk page for an encyclopedia article. If you find this page on any site other than Wikipedia, you are viewing a mirror site. Be aware that the page may be outdated and that the user in whose space this page is located may have no personal affiliation with any site other than Wikipedia. The original page is located at https://en.wikipedia.org/wiki/User:Epipelagic/sandbox/ref1. |
RESOURCES AND WORKING DRAFTS ONLY
Rise of the diatoms[edit]
"Diatoms—phytoplankton that construct their shells out of silica—are critical to marine food webs and geochemical cycles. They account for ∼40% of marine primary productivity today (1), but are a relatively recent contributor to ocean ecosystems (2). Diatoms first appear in the fossil record in the Jurassic (3) and become ecologically dominant among phytoplankton during the Cenozoic (4, 5). Hypothesized explanations for their middle to late Cenozoic rise include the decline in atmospheric CO2 concentrations over the last 40 My, sea level change, an increase in bioavailable silica reaching the ocean due to elevated continental weathering and/or the expansion of grasslands, and changes in nutrient focusing due to cooler temperatures, among others (5–9)."[1]
"The timing and cause of diatoms' ascension is important beyond simply reconstructing the history of marine primary producers—it represents a major shift in Earth's silica and carbon cycles. Diatoms are believed to have drawn down ocean silica concentrations to their lowest levels in Earth's history (10), which, studies suggest, could have fundamentally changed climate regulation by altering marine authigenic clay formation (11, 12). A shift from calcifying to silicifying plankton also partially decouples inorganic and organic carbon and leads to a tighter coupling of organic carbon (along with nitrogen and phosphorous) to silica (3, 13, 14). In addition, the evolution of relatively large, well-protected phytoplankton lineages including diatoms, coccolithophores, and dinoflagellates, and their subsequent rise in ecological significance, is hypothesized to be the bottom-up impetus for massive ocean ecosystem restructuring in the Mesozoic and Cenozoic (15)."[1]
"Recent work (16–18) has called into question the classic timeline of diatoms' increase in abundance and diversity (Fig. 1A). It has been assumed, based on fossil databases, that diatom diversity and abundance were generally very low at the beginning of the Cenozoic and increased toward the present, with a rapid rise beginning around the middle Miocene (23 Ma to 5 Ma) (8, 19, 20). Diatom abundance has, for the most part, been inferred from diatom diversity (21–23), although there is a similar increase in the relative abundance of diatoms in deep-sea sediments (5). Punctuating this long-term trend, siliceous microfossil (and radiolarian) abundance peaks in the Middle Eocene (5, 24) and is followed by a peak in diatom diversity in the latest Eocene to early Oligocene (10, 20, 21, 25, 26). Prior to the ecological rise of diatoms, radiolarians, a group of heterotrophic to mixotrophic protists, were the dominant pelagic silicifiers. As diatoms expanded, seawater silica concentrations are believed to have declined more than tenfold, leading to range contractions, reduced silicification, and reduced abundance in radiolarians and other silicifiers (11, 22, 23, 27–30). However, paired sponge and radiolarian silicon isotope work suggests roughly constant surface water silica concentrations between the latest Paleocene (60 Ma) and the Oligocene (33 Ma), at levels equivalent to modern surface ocean concentrations (<60 µM) (17) (Fig. 1). The Si isotope proxy builds from the observations that the extent of fractionation in sponges is strongly dependent on ambient dissolved Si concentration, while fractionation in radiolarians is mostly Si concentration independent (17, 31–36). In other words, these Si isotope findings suggest that any diatom-driven drawdown of silica must have occurred prior to the late Paleocene. Consistent with this alternative, Si isotope hypothesis, sponge reefs and hypersilicification in neritic sponges (indicative of high silica concentrations) disappeared in the Cretaceous to lower Paleocene (37). However, changes in Si isotope values in the Southern Ocean suggest yet another chronology, with diatom abundance increasing to near modern levels during the Eocene (10)."[1]
- ^ a b c Westacott, Sophie; Planavsky, Noah J.; Zhao, Ming-Yu; Hull, Pincelli M. (2021-06-28). "Revisiting the sedimentary record of the rise of diatoms". Proceedings of the National Academy of Sciences. 118 (27). Proceedings of the National Academy of Sciences. doi:10.1073/pnas.2103517118. ISSN 0027-8424.
Salt marsh hydrogeology[edit]
Salt marshes are often overlooked through the lens of groundwater–surface water interactions due to the low permeability of marsh sediments. While a large body of literature exists on groundwater–surface water exchange in the coastal zone [1,2,3], groundwater–surface water exchange in salt marshes is understudied compared to beach and nearshore environments. To this end, tidal marsh hydrogeology has recently been highlighted as a critical knowledge gap in the field [3] and has received renewed attention for its role in mediating chemical exports to the coastal ocean [4,5,6].[1]
Salt marshes, a subset of coastal wetlands, are fine-grained intertidal ecosystems located along shorelines ranging from ocean margins to the freshwater–seawater interface. Generally, salt marshes consist of a surface unit of organic-rich, low permeability peat, mud, and clay that overtops sandy estuarine sediments, and are therefore distinct from sand-dominated beach environments. The marsh sediment depth varies depending on age, energy regime, and geologic history [7]. These periodically inundated peat- or mud-rich deposits and the area that they encompass are referred to as the marsh platform and are often incised by tidal creeks and channels that act as conduits to the coastal ocean [8]. Salt marshes occur across a range of tidal regimes (i.e., microtidal to megatidal) and geomorphological settings (e.g., restricted-entrance embayment, open coast back-barrier, fringing) [9,10]. Contributing to or stemming from these hydrological and geomorphological characteristics, a diversity of salt- and/or saturation-tolerant plant species colonize marsh platforms including Spartina alterniflora and Spartina patens.[1]
Rates of groundwater–surface water exchange in salt marshes can greatly exceed inner shelf and beach environments [11], in part due to the unique permeability structure and geometry of marsh ecosystems. Vegetation (rhizomes and roots) [12], bioturbating organisms [13,14], sandy lenses [15] and macropore structures [16] collectively enhance the effective permeability of otherwise muddy, impermeable marsh sediments. Tidal creeks, and thus the creek network type, can enhance the effective area of groundwater–surface water exchange [17]. Marsh sediments and pore waters are frequently enriched in nutrients [18] and carbon [19] relative to coarser-grained systems (i.e., beaches) and have been shown to export vast quantities of carbon and nutrients into tidal creeks and the coastal ocean [20,21].[1]
The idea that salt marshes export carbon and nutrients to the coastal ocean is the basis of the outwelling hypothesis, which states that salt marshes outwell excess organic matter, dissolved carbon and nutrients to tidal channels, estuaries and the coastal ocean via tidal drainage and exchange [22,23]. Initially, the outwelling discussion was largely centered around nutrient (and predominantly nitrogen) fluxes [20,24,25,26]. Recent advances in blue carbon science have linked salt marshes to regional carbon budgets [5,27,28], thus renewing interest in the outwelling hypothesis. While salt marsh biogeochemistry mediates the quantity and form of nutrients and carbon [29], the magnitude of groundwater–surface water exchange will ultimately drive removal (internal consumption or adsorption onto sediments) or lateral export (i.e., outwelling). Thus, the quantification of salt marsh groundwater–surface water exchange is critical to understand interecosystem variability, and to accurately upscale fluxes between local, regional and global scales.[1]
- ^ a b c d Guimond, Julia; Tamborski, Joseph (2021-02-20). "Salt Marsh Hydrogeology: A Review". Water. 13 (4). MDPI AG: 543. doi:10.3390/w13040543. ISSN 2073-4441.
{{cite journal}}: CS1 maint: unflagged free DOI (link) Modified material was copied from this source, which is available under a Creative Commons Attribution 4.0 International License.
Terrestrial silicon[edit]

Global silicon cycling regulates atmospheric carbon dioxide concentrations via several well-known mechanisms, particularly chemical weathering of mineral silicates [1], occlusion of carbon to soil phytoliths [2], and the oceanic biological silicon pump [3]. The vast majority of research on silicon cycling has focused on the oceans, where silicon-replete diatoms sequester 240 Tmol Si yr−1 [4]. Diatoms are also a critical component of the global carbon cycle, accounting for 35–75% of marine net primary production (NPP) [4] and serving as efficient exporters of carbon to the benthos [5].[1]
However, similar to diatoms, terrestrial vegetation can also sequester large amounts of silicon. Silicon is considered a "quasi-essential" nutrient for plants [6]. While most plants can grow in silicon-deplete soils, plant fitness is markedly improved with silicon amendments [7]. In fact, silicon is the only element that has been shown to never be toxic to plants even in high doses [7]. Silicon protects plants from a variety of abiotic and biotic stresses, including desiccation, predation, fungal attack, and heavy metal toxicity [6]–[8]. Ultimately, silicon plays a critical role in plant defense [6], which we argue better facilitates plants to perform essential services, particularly carbon sequestration.[1]
Silicon concentrations in land plants range over two orders of magnitude (<0.1 to over 10% by dry weight (by wt.)), the largest range of any element [6]. All photosynthetic plants contain some silicon within their tissue, often in concentrations equal to or greater than other macronutrients, such as nitrogen (N), phosphorus (P), and potassium (K) [8]. Plants are typically broken into three modes of silicon uptake: rejective, passive accumulators, or active accumulators [7]. Plants whose silicon uptake is greater than that which would passively be taken up through the transpiration stream are defined as active accumulators and typically contain >0.46% silicon (or 1% SiO2) by weight. [7], [9], [10].[1]
Plants take up dissolved silica (H4SiO4) from soil solution via their roots. Dissolved silica is transported via the xylem for eventual deposition in transpiration termini. Upon incorporation into organisms, biogenic silica is formed, creating siliceous bodies in cell walls known as phytoliths. While the ultimate source of silicon in the biosphere is chemical weathering of mineral silicates, biogenic silica is 7 to 20 times more soluble than mineral silicates [11], resulting in biogenic silica being an important source of dissolved silica on biological time scales [12]. The dynamic cycling of silicon on its path from land to sea has only recently been documented [11], [13], demonstrating that the biological component of the global silicon cycle is driven not only by diatoms, but also by terrestrial organisms [14].[1]
Because certain plants, such as grasses, fix more Si than others, fixation of Si on land is far from uniform.[1]
ABSTRACT: Silicon (Si) cycling controls atmospheric CO2 concentrations and thus, the global climate, through three well-recognized means: chemical weathering of mineral silicates, occlusion of carbon (C) to soil phytoliths, and the oceanic biological Si pump. In the latter, oceanic diatoms directly sequester 25.8 Gton C yr−1, accounting for 43% of the total oceanic net primary production (NPP). However, another important link between C and Si cycling remains largely ignored, specifically the role of Si in terrestrial NPP. Here we show that 55% of terrestrial NPP (33 Gton C yr−1) is due to active Si-accumulating vegetation, on par with the amount of C sequestered annually via marine diatoms. Our results suggest that similar to oceanic diatoms, the biological Si cycle of land plants also controls atmospheric CO2 levels. In addition, we provide the first estimates of Si fixed in terrestrial vegetation by major global biome type, highlighting the ecosystems of most dynamic Si fixation. Projected global land use change will convert forests to agricultural lands, increasing the fixation of Si by land plants, and the magnitude of the terrestrial Si pump.[1]
- ^ a b c d e f g Carey, Joanna C.; Fulweiler, Robinson W. (2012-12-31). "The Terrestrial Silica Pump". PLoS ONE. 7 (12). Public Library of Science (PLoS): e52932. doi:10.1371/journal.pone.0052932. ISSN 1932-6203.
{{cite journal}}: CS1 maint: unflagged free DOI (link) Modified material was copied from this source, which is available under a Creative Commons Attribution 4.0 International License.
Mangroves[edit]
Silicon (Si) is the second most abundant element in the Earth’s crust, and is released as silicic acid [dissolved silica (DSi); Si(OH)4] via weathering. A variety of marine organisms are silicifiers including diatoms, radiolarians, silicoflagellates, select sponges, and even picocyanobacteria (Tréguer and De La Rocha, 2013). Photosynthesizing silicifiers (e.g., diatoms) take up significant amounts of Si along with nitrogen, phosphorus, and inorganic carbon, tightly coupling these biogeochemical cycles (Tréguer et al., 2021). Diatoms are responsible for ∼50% of oceanic primary productivity (Rousseaux and Gregg, 2013) and are an important source of carbon (C) export to the deep ocean (Tréguer et al., 2018). Diatoms also play a key role in coastal productivity and food web structure (Hackney et al., 2002).[1]
Over 80% of the annual inputs of DSi to the global ocean comes from land (Tréguer and De La Rocha, 2013). While rivers are the primary transport mechanism, the path of DSi from land to sea is not direct (Struyf and Conley, 2012). Over the last two decades a new paradigm has emerged that highlights the importance of Si uptake by terrestrial vegetation, with land plants intercepting Si as it makes its way along the land-ocean continuum (Conley, 2002; Carey and Fulweiler, 2012). In fact, Si is rapidly recycled through the terrestrial plant reservoir, and this terrestrial cycle helps regulate the flux of Si from continents (Conley, 2002; Carey and Fulweiler, 2012; Struyf and Conley, 2012). Plants take up DSi from the soil solution and groundwater via their roots and transport it throughout the plant where it is deposited as biogenic silica (BSi; Epstein, 1994; Raven, 2003). BSi mostly accumulates as siliceous bodies known as phytoliths at transpiration termini (Epstein, 1994; Raven, 2003). Plants return this BSi to soils, chiefly as litter fall, where it dissolves seven to 20 times faster than mineral silicates (Fraysse et al., 2009; Cornelis et al., 2011). Thus on biological time scales, terrestrial vegetation plays an important yet not fully understood role in altering Si cycling within and across ecosystems.[1]
Wetlands are borderland ecosystems–not quite terrestrial, not quite aquatic. Yet, they play an important role in regulating the availability of Si in downstream ecosystems. All plants contain some Si in their tissue, with concentrations ranging from <0.1 to 10% by dry weight (Epstein, 1999; Raven, 2003; Hodson et al., 2005). Some plants, like those that characterize wetlands (e.g., grasses and sedges), have particularly high BSi concentrations. Thus wetlands are described as “hot spots” for Si cycling (Struyf and Conley, 2009). Wetland sediments also typically contain elevated amorphous silica (ASi) concentrations (Norris and Hackney, 1999; Struyf et al., 2010), particularly in the top sediment layers (Carey and Fulweiler, 2013). ASi is comprised mostly of the BSi fraction in soils, sourced from both plant BSi and benthic algae growth (Carey and Fulweiler, 2013). ASi is also comprised of the non-mineral pedogenic fraction, such as the Si sorbed to iron and aluminum oxi/hydroxides (Saccone et al., 2007; Cornelis et al., 2011). Substantial research effort has focused on Si cycling in temperate wetland ecosystems, specifically tidal freshwater and saltwater marshes, where large Si reservoirs in sediments, plants, and porewater have been documented (Struyf et al., 2005; Carey and Fulweiler, 2013; Müller, 2013). Tidal exchange connects salt marsh Si reservoirs to adjacent estuarine systems, often supplying substantial quantities of DSi to marine waters (Vieillard et al., 2011; Müller et al., 2013; Carey and Fulweiler, 2014a).[1]
While evidence points to the dynamic and critical role of salt marshes in coastal temperate Si cycling, the role of salt marshes’ lower latitude counterpart–mangroves–in tropical coastal Si cycling remains unknown. We hypothesized that mangroves are significant reservoirs of Si and that their high productivity could make them an important, yet overlooked, driver of tropical Si cycling.[1]
- ^ a b c d Elizondo, Elani B.; Carey, Joanna C.; Al-Haj, Alia N.; Lugo, Ariel E.; Fulweiler, Robinson W. (2021-05-20). "High Productivity Makes Mangroves Potentially Important Players in the Tropical Silicon Cycle". Frontiers in Marine Science. 8. Frontiers Media SA. doi:10.3389/fmars.2021.652615. ISSN 2296-7745.
{{cite journal}}: CS1 maint: unflagged free DOI (link) Modified material was copied from this source, which is available under a Creative Commons Attribution 4.0 International License.
Turing morphogenesis[edit]
Bernard Richards studied mathematics and physics for his bachelor's degree.[1] For his master's degree, he worked under the supervision of Alan Turing (1912–1954) at Manchester as one of Turing's last students, helping to validate Turing’s theory of morphogenesis.[2][3][4]
"Turing was keen to take forward the work that D’Arcy Thompson had published in On Growth and Form in 1917".[4]
So I set to work on seeking a solution to the Morphogenesis Equations on a sphere. The theory was that a spherical organism was subject to diffusion across its surface membrane by an alien substance, eg sea-water. The Equations were:
The function , taken to be the radius vector from the centre to any point on the surface of the membrane, was argued to be representable as a series of normalised Legendre functions. The algebraic solution of the above equations ran to some 30 pages in my Thesis and are therefore not reproduced here. They are written in full in the book entitled “Morphogenesis” which is a tribute to Turing, edited by P. T. Saunders, published by North Holland, 1992.[5]
The algebraic solution of the equations revealed a family of solutions, corresponding to a parameter n, taking values 2, 4. 6.
When I had solved the algebraic equations, I then used the computer to plot the shape of the resulting organisms. Turing told me that there were real organisms corresponding to what I had produced. He said that they were described and depicted in the records of the voyages of HMS Challenger in the 19th Century.
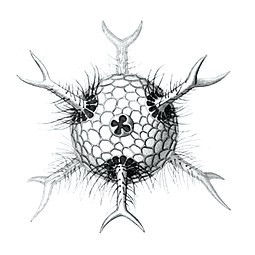
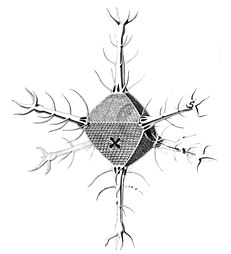
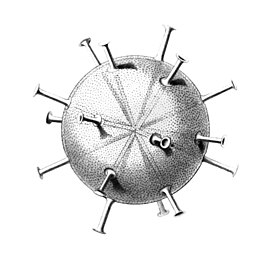
I solved the equations and produced a set of solutions which corresponded to the actual species of Radiolaria discovered by HMS Challenger in the 19th century. That expedition to the Pacific Ocean found eight variations in the growth patterns. These are shown in the following figures. The essential feature of the growth is the emergence of elongated "spines" protruding from the sphere at regular positions. Thus the species comprised two, six, twelve, and twenty, spine variations.


Bernard Richards, 2006 [6]
- Spine variations in radiolarians as discovered by HMS Challenger in the 19th century and drawn by Ernst Haeckel
-
 Cromyatractus tetracelyphus with 2 spines
 -
 Circopus sexfurcus with 6 spines
 -
 Circopurus octahedrus with 6 spines and 8 faces
 -
 Circogonia icosahedra with 12 spines and 20 faces
 -
 Circorrhegma dodecahedra with 20 (incompletely drawn) spines and 12 faces
 -
 Cannocapsa stethoscopium with 20 spines


The gallery shows images of the radioarians as extracted from drawings made by the German zoologist and polymath Ernst Haeckel in 1887.
- Turing, Alan (1952). "The Chemical Basis of Morphogenesis" (PDF). Philosophical Transactions of the Royal Society of London B. 237 (641): 37–72. Bibcode:1952RSPTB.237...37T. doi:10.1098/rstb.1952.0012. JSTOR 92463. S2CID 120437796.
- Richards, Bernard (2005-2006) "Turing, Richards and Morphogenesis", The Rutherford Journal, Volume 1.
- ^ Copeland, Jack; Bowen, Jonathan; Sprevak, Mark; Wilson, Robin; et al. (2017). "Notes on Contributors". The Turing Guide. Oxford University Press. p. 478. ISBN 978-0198747833.
- ^ Richards, Bernard (1954), "The Morphogenesis of Radiolaria", MSc thesis, Manchester, UK: The University of Manchester
- ^ Richards, Bernard (2005). "Turing, Richards and morphogenesis". The Rutherford Journal. 1.
- ^ a b Richards, Bernard (2017). "Chapter 35 – Radiolaria: Validating the Turing theory". In Copeland, Jack; et al. (eds.). The Turing Guide. pp. 383–388.
- ^ Turing, Alan; Saunders, P. T. (1992). Morphogenesis (in Esperanto). Amsterdam: North-Holland. ISBN 978-0-08-093405-1. OCLC 680063781.
- ^ Richards, Bernard (2006) "Turing, Richards and Morphogenesis", The Rutherford Journal, Volume 1.
Freshwater phytoplankton[edit]
As primary producers, phytoplankton form the base of the pelagic environment of freshwater ecosystems. A healthy, diverse phytoplankton community is necessary for proper ecosystem function and balance, playing a substantial role in important ecosystem processes, such as nutrient and organic matter cycling. Diversity is maintained through species interactions (e.g., competition for resources, epiphytic associations, antagonistic behavior), shifting environmental conditions, and periodic disturbances (Biddanda et al., 2021, Sigee, 2005). In temperate dimictic freshwater lakes, such as those in the Great Lakes region, a predictable seasonal succession of phytoplankton community composition responds to temporal shifts in environmental variables. Briefly, phytoplankton growth is comparatively low in the winter; a diatom bloom occurs in the spring, as diatoms thrive in turbulent, low-light environments and variable nutrient concentrations; in late-spring, a clear-water phase occurs as resources deplete and zooplankton grow; small, fast-growing, inedible species (e.g., cryptomonads and chlorophytes) occur in low abundance near the end of this phase; a mixed bloom occurs in the summer and fall, including cyanobacteria, cryptophytes, chlorophytes, and dinoflagellates; and then diatoms often see a fall resurgence (Dodds and Whiles, 2019, Sommer, 1989).[1]

While phytoplankton are cosmopolitan in nature, their diversity is found to vary across latitudinal, longitudinal, and altitudinal gradients (Stomp et al., 2011). Phytoplankton community diversity is largely controlled through bottom-up mechanisms, such as nutrients, temperature, and light. Therefore, changes in land use and climate that impact local environmental variables threaten the biological integrity of the phytoplankton community (Stomp et al., 2011, Zhang et al., 2016). Furthermore, Ptacnik et al., 2008, Ye et al., 2019 found that resource use efficiency positively correlated with phytoplankton diversity in freshwater, marine, and brackish ecosystems. Therefore, anthropogenically induced changes in community composition can lead to community imbalances, decreased diversity, reduced carbon cycling efficiency, and inability of phytoplankton to maintain stable populations (Bergkemper et al., 2018, Ptacnik et al., 2008, Urrutia-Cordero et al., 2017, Ye et al., 2019). As low points in the landscape that integrate changes in the watershed, lakes serve as reliable sentinels of climate change and hot spots of carbon cycling (Biddanda, 2017, Williamson et al., 2009). As such, phytoplankton are useful indicators of changing conditions due to their fast growth rates, short life cycles, high abundance, small size, and high reactivity (Cai and Reavie, 2018, Reavie et al., 2014b).[1]

- ^ a b Mancuso, Jasmine L.; Weinke, Anthony D.; Stone, Ian P.; Hamsher, Sarah E.; Villar-Argaiz, Manuel; Biddanda, Bopaiah A. (2021). "Cold and wet: Diatoms dominate the phytoplankton community during a year of anomalous weather in a Great Lakes estuary". Journal of Great Lakes Research. 47 (5). Elsevier BV: 1305–1315. doi:10.1016/j.jglr.2021.07.003. ISSN 0380-1330. Modified material was copied from this source, which is available under a Creative Commons Attribution 4.0 International License.
filamentous cyanobacteria[edit]
Cyanobacteria are ubiquitous, finding habitats in most water bodies and in extreme environments such as the polar regions, deserts, brine lakes and hot springs.[1][2][3] They have also evolved surprisingly complex collective behaviours that lie at the boundary between single-celled and multicellular life. For example, filamentous cyanobacteria live in long chains of cells (figure 1) that bundle together into larger structures including biofilms, biomats and stromatolites.[4][5] These large colonies provide a rigid, stable and long-term environment for their communities of bacteria. In addition, cyanobacteria-based biofilms can be used as bioreactors to produce a wide range of chemicals, including biofuels like biodiesel and ethanol.[6] However, despite their importance to the history of life on Earth, and their commercial and environmental potentials, there remain basic questions of how filamentous cyanobacteria move, respond to their environment and self-organize into collective patterns and structures.[7]
All known cyanobacteria lack flagella;[8] however, many filamentous species move on surfaces by gliding, a form of locomotion where no physical appendages are seen to aid movement.[9] The actual mechanism behind gliding is not fully understood, although over a century has elapsed since its discovery.[10][11] One theory suggests that gliding motion in cyanobacteria is mediated by the continuous secretion of polysaccharides through pores on individual cells.[12][13][14] Another theory suggests that gliding motion involves the use of type IV pili, polymeric assemblies of the protein pilin,[15] as the driving engines of motion.[16][17][18] However, it is not clear how the action of these pili would lead to motion, with some suggesting they retract,[19], while others suggest they push,[20] to generate forces. Other scholars have suggested surface waves generated by the contraction of a fibril layer as the mechanism behind gliding motion in Oscillatoria.[21][22] Recent work also suggests that shape fluctuations and capillary forces could be involved in gliding motion.[23][7]
Through collective interaction, filamentous cyanobacteria self-organize into colonies or biofilms, symbiotic communities found in a wide variety of ecological niches. Their larger-scale collective structures are characterized by diverse shapes including bundles, vortices and reticulate patterns.[24][25] Similar patterns have been observed in fossil records.[26][27][28] For filamentous cyanobacteria, the mechanics of the filaments is known to contribute to self-organization, for example in determining how one filament will bend when in contact with other filaments or obstacles.[29] Further, biofilms and biomats show some remarkably conserved macro-mechanical properties, typically behaving as viscoelastic materials with a relaxation time of about 20 min.[30][7]
- ^ . doi:10.1016/S0070-4571(08)71140-3.
{{cite journal}}: Cite journal requires|journal=(help); Missing or empty|title=(help) - ^ . doi:10.1669/0883-1351(2002)017<0084:CSFGSN>2.0.CO;2.
{{cite journal}}: Cite journal requires|journal=(help); Missing or empty|title=(help) - ^ . doi:10.2216/i0031-8884-22-4-355.1.
{{cite journal}}: Cite journal requires|journal=(help); Missing or empty|title=(help) - ^ . doi:10.1007/978-94-007-3855-3.
{{cite journal}}: Cite journal requires|journal=(help); Missing or empty|title=(help) - ^ . doi:10.1007/978-94-007-3855-3_4.
{{cite journal}}: Cite journal requires|journal=(help); Missing or empty|title=(help) - ^ . doi:10.1002/btpr.2835).
{{cite journal}}: Cite journal requires|journal=(help); Missing or empty|title=(help) - ^ a b c Faluweki, Mixon K.; Goehring, Lucas (2022). "Structural mechanics of filamentous cyanobacteria". Journal of The Royal Society Interface. 19 (192). The Royal Society. doi:10.1098/rsif.2022.0268. ISSN 1742-5662. Modified text was copied from this source, which is available under a Creative Commons Attribution 4.0 International License.
- ^ . doi:10.1099/00221287-111-1-1.
{{cite journal}}: Cite journal requires|journal=(help); Missing or empty|title=(help) - ^ . doi:10.1007/s002030000187.
{{cite journal}}: Cite journal requires|journal=(help); Missing or empty|title=(help) - ^ Hansgirg A. (1883) "Bemerkungen über die Bewegungen der Oscillarien". Bot. Ztg., 41: 831.
- ^ Drews G. (1959) "Beitröge zur Kenntnis der phototaktischen Reaktionen der Cyanophyceen". Arch. Protistenk. 104: 389–430.
- ^ . doi:10.15281/jplantres1887.64.14.
{{cite journal}}: Cite journal requires|journal=(help); Missing or empty|title=(help) - ^ . doi:10.1007/BF01666380.
{{cite journal}}: Cite journal requires|journal=(help); Missing or empty|title=(help) - ^ . doi:10.1016/S0960-9822(07)00487-3.
{{cite journal}}: Cite journal requires|journal=(help); Missing or empty|title=(help) - ^ . doi:10.1038/nrmicro885.
{{cite journal}}: Cite journal requires|journal=(help); Missing or empty|title=(help) - ^ . doi:10.1128/JB.01927-06.
{{cite journal}}: Cite journal requires|journal=(help); Missing or empty|title=(help) - ^ . doi:10.1111/mmi.12552.
{{cite journal}}: Cite journal requires|journal=(help); Missing or empty|title=(help) - ^ . doi:10.1111/mmi.13205.
{{cite journal}}: Cite journal requires|journal=(help); Missing or empty|title=(help) - ^ . doi:10.1099/mic.0.000064).
{{cite journal}}: Cite journal requires|journal=(help); Missing or empty|title=(help) - ^ . doi:10.1111/mmi.13205.
{{cite journal}}: Cite journal requires|journal=(help); Missing or empty|title=(help) - ^ . doi:10.1038/2251163a0.
{{cite journal}}: Cite journal requires|journal=(help); Missing or empty|title=(help) - ^ . doi:10.1111/j.1529-8817.1971.tb01492.x.
{{cite journal}}: Cite journal requires|journal=(help); Missing or empty|title=(help) - ^ . doi:10.1073/pnas.1914678116.
{{cite journal}}: Cite journal requires|journal=(help); Missing or empty|title=(help) - ^ . doi:10.1111/j.1472-4669.2010.00235.x.
{{cite journal}}: Cite journal requires|journal=(help); Missing or empty|title=(help) - ^ . doi:10.1016/j.earscirev.2016.01.005.
{{cite journal}}: Cite journal requires|journal=(help); Missing or empty|title=(help) - ^ . doi:10.1038/nature04764.
{{cite journal}}: Cite journal requires|journal=(help); Missing or empty|title=(help) - ^ . doi:10.1016/j.earscirev.2016.01.005.
{{cite journal}}: Cite journal requires|journal=(help); Missing or empty|title=(help) - ^ . doi:10.2307/3515333.
{{cite journal}}: Cite journal requires|journal=(help); Missing or empty|title=(help) - ^ . doi:10.3390/life4030433.
{{cite journal}}: Cite journal requires|journal=(help); Missing or empty|title=(help)CS1 maint: unflagged free DOI (link) - ^ . doi:10.1103/PhysRevLett.93.098102.
{{cite journal}}: Cite journal requires|journal=(help); Missing or empty|title=(help)
CF[edit]

-
 Guilin cormorant fisherman
 -
 Chinese fisherman with his cormorants
 -


-
 Fishing with cormorants in China, circa 1894
 -
 Contemporary fishing with cormorants on Poyang Lake, China


-
 Yangshuo cormorant fisherman
 -
 Chinese cormorant fisherman traditionally use bamboo boats


Plastic pollution[edit]


.jpg)


<ref> tag has too many names (see the help page).


<ref> tag has too many names (see the help page).


<ref> tag has too many names (see the help page).References[edit]
- ^ Lebreton, Laurent C. M.; Van Der Zwet, Joost; Damsteeg, Jan-Willem; Slat, Boyan; Andrady, Anthony; Reisser, Julia (2017). "River plastic emissions to the world's oceans". Nature Communications. 8: 15611. Bibcode:2017NatCo...815611L. doi:10.1038/ncomms15611. PMC 5467230. PMID 28589961. Material was copied from this source, which is available under a Creative Commons Attribution 4.0 International License.
- ^ "Microplastics in marine mammals stranded around the British coast: ubiquitous but transitory?". doi:10.1038/s41598-018-37428-3.
{{cite journal}}: Cite journal requires|journal=(help) - ^ "Trophic Transfer of Microplastics From Copepods to Jellyfish in the Marine Environment". doi:10.3389/fenvs.2020.571732.
{{cite journal}}: Cite journal requires|journal=(help)CS1 maint: unflagged free DOI (link) Material was copied from this source, which is available under a Creative Commons Attribution 4.0 International License.
- ^ . doi:10.7185/geochemlet.1829.
{{cite journal}}: Cite journal requires|journal=(help); Missing or empty|title=(help) - ^ . doi:10.3389/fmars.2018.00238.
{{cite journal}}: Cite journal requires|journal=(help); Missing or empty|title=(help)CS1 maint: unflagged free DOI (link) Material was copied from this source, which is available under a Creative Commons Attribution 4.0 International License.
- ^ . doi:10.3389/fmars.2020.609243.
{{cite journal}}: Cite journal requires|journal=(help); Missing or empty|title=(help)CS1 maint: unflagged free DOI (link) Material was copied from this source, which is available under a Creative Commons Attribution 4.0 International License.
- ^ Center for International Environmental Law (2019) [Plastic & Climate, The Hidden Costs of a Plastic Planet.
- ^ . doi:10.1126/science.1260352.
{{cite journal}}: Cite journal requires|journal=(help); Missing or empty|title=(help) - ^ . doi:10.1088/1748-9326/10/12/124006.
{{cite journal}}: Cite journal requires|journal=(help); Missing or empty|title=(help) - ^ a b . doi:10.1016/j.tim.2020.06.011.
{{cite journal}}: Cite journal requires|journal=(help); Missing or empty|title=(help) Material was copied from this source, which is available under a Creative Commons Attribution 4.0 International License.
- ^ . doi:10.1038/s41467-021-22554-w.
{{cite journal}}: Cite journal requires|journal=(help); Missing or empty|title=(help) Material was copied from this source, which is available under a Creative Commons Attribution 4.0 International License.
- ^ . doi:10.1016/j.envpol.2018.10.065.
{{cite journal}}: Cite journal requires|journal=(help); Missing or empty|title=(help) Material was copied from this source, which is available under a Creative Commons Attribution 4.0 International License.
- ^ a b Cite error: The named reference
Chatterjee2019was invoked but never defined (see the help page). - ^ a b . doi:10.1016/j.scitotenv.2021.145520.
{{cite journal}}: Cite journal requires|journal=(help); Missing or empty|title=(help) Material was copied from this source, which is available under a Creative Commons Attribution 4.0 International License.
- ^ . doi:10.1038/s42003-020-0789-4.
{{cite journal}}: Cite journal requires|journal=(help); Missing or empty|title=(help) Material was copied from this source, which is available under a Creative Commons Attribution 4.0 International License.
- ^ a b . doi:10.1016/j.envsci.2020.04.007.
{{cite journal}}: Cite journal requires|journal=(help); Missing or empty|title=(help) Material was copied from this source, which is available under a Creative Commons Attribution 4.0 International License.
- ^ Dussud, C. and Ghiglione, J.F. (2014) Bacterial degradation of synthetic plastics. In: CIESM Workshop Monograph, 46: 49–54.
- ^ a b . doi:10.3390/jmse8110945.
{{cite journal}}: Cite journal requires|journal=(help); Missing or empty|title=(help)CS1 maint: unflagged free DOI (link) Material was copied from this source, which is available under a Creative Commons Attribution 4.0 International License.
Labil versus recalcitrant[edit]
| Header text | scholar | books | |
|---|---|---|---|
| recalcitrant doc | 5,340 | 659 | 448 |
| refractory doc | 8,510 | 1270 | 937 |
| semi-refractory | |||
| labile doc | 21,500 | 3130 | 1260 |
| semi-labile |
"Labile" recalcitrant|refractory "dissolved organic carbon"|"dissolved organic matter"|"dissolved organic material" labile
humic non-humic purgeable particulate
"particulate organic carbon" "purgeable organic carbon"
"organic carbon"|"organic matter" recalcitrant|refractory humic purgeable [1]
ORIGIN & FATE OF MARINE ORGANIC CARBON - Organic matter from phytoplankton cells utilized (by bacteria), grazed (by zooplankton) & lysed (by viruses) UNPUBLISHED: Klip, H.C.L. (2019) Faculty of Geosciences Theses (Master thesis) Abstract "In the marine realm, phytoplankton form the base of the food web and are key for the biological pump. While bottom-up factors regulate phytoplankton productivity and growth, top-down factors (e.g. predation, viral lysis, and sedimentation) regulate their standing stock. Due to viral lysis, particulate organic matter (POM) is transferred to dissolved organic carbon. Thereby, organic matter and energy are shunted towards the microbial loop and away from higher trophic levels. The aim of this MSc project is to investigate different pathways of organic matter and aggregate production, i.e. through viral lysis (from POM to DOM) of 2 phytoplankton species, and sloppy feeding and egestion by 2 zooplankton species. Fluorescent dissolved organic matter (FDOM) production was followed over time using axenic and non-axenic cultures to which bacteria were added in order to study the influence of bacterial presence on the FDOM composition. Additionally, the potential effects of cell size and temperature were taken into account. The results from the zooplankton experiments focusing on sloppy feeding showed that the FDOM quality is taxonomic phylum specific with the ciliate producing relatively more labile and the heterotrophic nanoflagellate more refractory FDOM, which is likely due to different feeding strategies. For the viral lysis derived FDOM, the results showed increased labile FDOM production under axenic conditions with a distinct impact on the share of labile and refractory by bacterial presence. Results varied with phytoplankton species (Phaeocystis globosa produced more FDOM compared to Micromonas commoda). Overall, the results indicate that nano- and microzooplankton as well as viral lysis and bacterial presence display a strong control on FDOM quantity and quality, which is of imperative importance for organic carbon cycling."
Inorganic carbon is carbon extracted from ores and minerals, as opposed to organic carbon found in nature through plants and living things. Some examples of inorganic carbon are carbon oxides such as carbon monoxide and carbon dioxide; polyatomic ions, cyanide, cyanate, thiocyanate, carbonate and carbide in carbon
"POC can be a good indicator of productivity in the euphotic zone. In terms of sea ports, the biotic and detritus components of POC could be used as indicators of pollution."
Particulate organic matter (section)[edit]
Laminarin[edit]

Laminarin is a major molecule in the marine carbon cycle.[3] Microscopic planktonic algae are the base of the marine food web. Although sugars are the most abundant biomolecules in land plants, their concentrations in marine plants appear surprisingly low. In 2020, Becker et al. used recently discovered enzymes to dissect microalgae inhabiting the sunlit ocean and found that 26 ± 17% of their biomass consists of the sugar polymer laminarin.[3] The concentration in algal cells increased markedly during the day, in analogy to the seasonal storage of energy in starchy roots and fruits of land plants. Vast quantities of laminarin discovered in the ocean underscore the importance of marine sugars in the global carbon cycle.[3]
Marine microalgae sequester as much CO2 into carbohydrates as terrestrial plants. Polymeric carbohydrates (i.e., glycans) provide carbon for heterotrophic organisms and constitute a carbon sink in the global oceans. The quantitative contributions of different algal glycans to cycling and sequestration of carbon remain unknown, partly because of the analytical challenge of quantifying glycans in complex biological settings. Becker et al. measured laminarin along transects in the Arctic, Atlantic, and Pacific oceans and during three time series in the North Sea. These data revealed a median of 26 ± 17% laminarin within the particulate organic carbon pool. The observed correlation between chlorophyll and laminarin suggests an annual production of algal laminarin of 12 ± 8 gigatons: that is, approximately three times the annual atmospheric carbon dioxide increase by fossil fuel burning. Their data also suggests that laminarin accounts for up to 50% of organic carbon in sinking diatom-containing particles, thus substantially contributing to carbon export from surface waters. Laminarin concentrations in the sunlit ocean are driven by light availability. Collectively, these observations highlight the prominent ecological role and biogeochemical function of laminarin in oceanic carbon export and energy flow to higher trophic levels.[3]
The production rate of organic carbon is controlled by the growth of photosynthetic microalgae in the sunlit ocean, where diatoms alone contribute about 40% of the marine primary production and convert equal amounts of carbon dioxide into biomass as tropical forests.[2][3]
References[edit]
- ^ Shen, Y. and Benner, R. (2018) "Mixing it up in the ocean carbon cycle and the removal of refractory dissolved organic carbon". Nature: Scientific reports, 8(1): 1–9. doi:10.1038/s41598-018-20857-5 Material was copied from this source, which is available under a Creative Commons Attribution 4.0 International License.
- ^ a b . doi:10.1073/pnas.2020790118.
{{cite journal}}: Cite journal requires|journal=(help); Missing or empty|title=(help) - ^ a b c d e f . doi:10.1073/pnas.1917001117.
{{cite journal}}: Cite journal requires|journal=(help); Missing or empty|title=(help) Material was copied from this source, which is available under a Creative Commons Attribution 4.0 International License.
Extremophiles[edit]


Prokaryotic life has dominated most of the evolutionary history of our planet, evolving to occupy virtually all available environmental niches. Extremophiles, especially those thriving under multiple extremes, represent a key area of research for multiple disciplines, spanning from the study of adaptations to harsh conditions, to the biogeochemical cycling of elements. Extremophile research also has implications for origin of life studies and the search for life on other planetary and celestial bodies.[1]
(Poly)extremophiles help predict the boundaries of life[edit]
Over the past century, the boundary conditions under which life can thrive have been pushed in every possible direction, encompassing broader swaths of temperature, pH, pressure, radiation, salinity, energy, and nutrient limitation. Microorganisms do not only thrive under such a broad spectrum of parameters on Earth, but can also survive the harsh conditions of space, an environment with extreme radiation, vacuum pressure, extremely variable temperature, and microgravity (Horneck et al., 2010; Yamagishi et al., 2018). The definition of “extreme conditions” has strong anthropocentric criteria, rather than microbial criteria, and can be the cause of confusion (Rothschild and Mancinelli, 2001). When considering extremophilic (as opposed to extremotolerant) organisms, it is important to keep in mind that these are highly adapted organisms for the conditions considered and that the “extreme” condition constitutes the norm under which the organism is able to metabolically and biochemically operate. Moreover, there are myriad environments on our planet’s surface – and especially subsurface – that exhibit extremes in one or more physical or chemical condition. Therefore, extremophiles and, in particular, polyextremophiles (Capece et al., 2013) might be the most abundant lifeforms on our planet. In addition, if we consider that the current planetary surface conditions on Earth (such as mean temperature, redox state, and oxygenic atmosphere) have only occurred for a short period of time compared to the existence of life (Knoll, 2015), we might conclude that the extremophilic way of life has actually dominated the evolutionary history of life on our planet.[1]
Over the past several decades, the isolation of culturable (poly)extremophiles and the identification of extreme microbial communities through various culture-independent approaches have provided key insights into the boundaries of life. Research on (poly)extremophiles has led to numerous advances in molecular biology and medicine (Babu et al., 2015; Coker, 2016; Durvasula and Rao, 2018), while simultaneously reshaping our understanding of the origins and evolution of life (Bertrand et al., 2015) and the potential for life on other planetary bodies (Schulze-Makuch, 2013). Several reviews have defined extremophiles (Table 1) (e.g., Rothschild and Mancinelli, 2001; Fang et al., 2010; Capece et al., 2013; Seckbach et al., 2013) and discussed the physiology and genetics of (poly)extremophiles in detail (e.g., chapters within Polyextremophiles: Life Under Multiple Forms of Stress, edited by Seckbach et al., 2013).[1]
Parameters that limit life[edit]

Our knowledge of life is based on the observable and measurable phenomena that occur on Earth, and is therefore limited to this instance of life. However, the laws of chemistry and physics have universal principles which enable us to extrapolate to the conditions under which life could survive elsewhere. These principles suggest that life requires a liquid solvent, an energy source, and building blocks (Schwieterman et al., 2018).[1]
While the bulk abundance of (inorganic) building blocks appears not to be a factor limiting the distribution of life on Earth (with subsurface environments as a possible exception, e.g., Hoehler and Jørgensen, 2013) and, potentially, other planetary bodies, the availability of a solvent is considered to be a key factor. While the potential for other liquid solvents to sustain extraterrestrial life is discussed in detail elsewhere (Schwieterman et al., 2018 and references therein), water is considered the most likely liquid solvent because of its cosmic abundance and physicochemical properties (Michiels et al., 2008; Schwieterman et al., 2018). Water, especially the availability of liquid water, appears to be the main factor controlling the dimensions of the biospace for life on Earth (i.e., the parameter space occupied by life). Liquid water acts both as a solvent and a reactant/product in biochemical reactions, and its numerous unique physicochemical properties have profoundly shaped the emergence and evolution of life on our planet. As discussed in this review below, water activity appears to be the single key parameter controlling the biospace of Earth’s life, and numerous other parameters limiting life (e.g., temperature and salinity) are, in fact, acting on the availability of water. At the ecosystem level, water can indirectly influence the variation of key physicochemical conditions, which in turn controls microbial community composition and diversity, profoundly influencing geobiochemical cycling (sensu Shock and Boyd, 2015).[1]
Life also needs a source of energy to power chemical reactions, and redox chemistry appears to be universal (Jelen et al., 2016). Physicochemical gradients create non-equilibrium redox conditions that have played an important role in the origins, evolution, and diversity of life. Redox and proton gradients were likely the two main mechanisms involved in the origins of life, initiating the necessary energy flux to drive metabolism and growth (Lane et al., 2010; Lane and Martin, 2012). Therefore, the current search for life’s limits has extended beyond temperature, pH, pressure, salinity, and radiation gradients (each parameter discussed in their respective sections) and also includes the possible energetic and nutrient limits of life (discussed in Hoehler and Jørgensen, 2013; LaRowe and Amend, 2015; Jones et al., 2018).[1]
The parameters discussed herein (temperature, pH, pressure, salinity, and radiation) correlate with each other and can influence the availability of nutrients and energy sources. Depending on the environment, certain parameters can more strongly influence microbial diversity over others, such as temperature in geothermal waters (Sharp et al., 2014), pH in soil communities (Rousk et al., 2010), salinity in saline lakes (Yang et al., 2016), and water content in dry climates (Dose et al., 2001). On the nano- and micro-scale level, the two most important factors are likely water activity and pH, which influence the chemiosmotic, energy-generating gradient at the cell level (Lane et al., 2010; Lane and Martin, 2012). In contrast, parameters that influence the macro-scale level vary with the ecosystem. For example, temperature plays a significant role in geothermal environments and influences such processes as water-rock interactions and degassing (Nordstrom et al., 2005; Fouke, 2011; Cole et al., 2013; Price and Giovannelli, 2017). Water-rock interactions can then impact microorganisms by limiting the availability of trace elements and electron donors/acceptors.[1]
Microorganisms have been detected in a variety of extreme environments (Figure 1), virtually in any location where liquid water is available for life to use. This demonstrates that life can adapt to a wide range of parameters (Figure 2). It is therefore imperative to determine the minima and maxima for each parameter, and even more importantly, to understand their combined effects, in order to evaluate the limits of Earth’s life and advance our understanding of the potential for life elsewhere.[1]
Acidity and alkalinity[edit]
Extremely low and high pH environments have been observed for different ecosystems on Earth (Table 2). Extreme pH values were observed for ecosystems contaminated by mining waste, with current extremes reported from Iron Mountain (Shasta County, CA, United States) (pH -3.6) (Nordstrom et al., 2000) and Gorka Lake (Chrzanow region, Poland) (pH 13.3; Czop et al., 2011). While there has yet to be any microbial community studies or isolation attempts for Gorka Lake, to the best of our knowledge, microbial communities have been explored at Iron Mountain (Baker and Banfield, 2003), with several microorganisms isolated [e.g., Thermoplasmales (Edwards et al., 2000), Acidithiobacillus ferrooxidans (Schrenk et al., 1998; Kelly and Wood, 2000), and Leptospirillum ferrooxidans (Schrenk et al., 1998)]. Despite this, there are currently no cultured or isolated microorganisms which can be grown at either of the listed extremes. Currently, the most extreme acidophile and alkaliphile can survive at pH 0 and pH 12.5, respectively (pHopt 0.7 and 11) (Table 3). The lowest pHmin -0.06 was observed for two hyperacidophilic Archaea known as Picrophilus oshimae and P. torridus (pHopt 0.7), isolated from a solfataric hot spring in Noboribetsu (Hokkaido, Japan) (Schleper et al., 1996). These heterotrophic and aerobic polyextremophiles can also withstand temperatures of up to 65°C (Topt = 60°C, Tmin = 47°C), potentially through increased cyclization of their tetraether membrane lipids as a generalized response to pH, temperature, and nutrient stress (Feyhl-Buska et al., 2016). Other thermoacidophiles also include those species within the genus Sulfolobus, in which several isolates are known to be genetically tractable (Quehenberger et al., 2017). In comparison to extreme acidophily, the highest pHmax of 12.5 was observed for an alkaliphilic, aerobic, mesophilic bacterium known as Serpentinomonas sp. B1 (pHopt 11), isolated from a terrestrial serpentinizing system, The Cedars (CA, United States) (Suzuki et al., 2014). Although there is a report of the highest pHmax 13 held by Plectonema nostocorum (Kingsbury, 1954), this has not been further confirmed. The largest pH range, as compared to other isolated microorganisms, was observed for Halomonas campisalis (pHrange 6–12), a haloalkaliphilic bacterium isolated from a soda lake (Soap Lake, WA, United States) (Mormile et al., 1999; Aston and Peyton, 2007) (Table 4).[1]
The pH has a significant effect on microorganisms and microbial consortia, ranging from the nano- to macro-scale level. All microorganisms must maintain a near neutral cytoplasmic pH to enable cellular functions for survival and metabolism (Krulwich et al., 2011; Jin and Kirk, 2018). The cytoplasmic pH of acidophilic bacteria is ∼6.0 while alkaliphilic bacteria have a cytoplasmic pH around 7.2–8.7 (Krulwich et al., 2011). For more information on the molecular mechanisms behind pH homeostasis, Krulwich et al. (2011) provide a detailed review. The homeostasis of protons (and other ions) through various transporters, including the ion-utilizing ATP synthase, was likely one of the first functions to develop within the earliest cells (Lane and Martin, 2012). Indeed, chemiosmosis is a property of both archaeal and bacterial cells (Lane et al., 2010). In addition to intracellular pH, microorganisms can excrete organic metabolites, such as lactic acid or acetic acid, thereby changing the immediate, surrounding pH (Zhang et al., 2016). Many acidophiles also have organic acid degradation pathways to prevent proton uncoupling by organic acids (Baker-Austin and Dopson, 2007). It has been demonstrated both in natural settings and laboratory cultures that microorganisms can significantly alter their environmental pH as a result of metabolic reactions. For example, sulfide, thiosulfate, and elemental sulfur oxidizers secrete sulfate and protons as by-products, significantly acidifying their environment. This ability is used industrially for the bio-leaching of sulfide ore deposit (Olson et al., 2003; Rohwerder et al., 2003) and it is largely responsible for the low pH of acid mine drainage fluids and other acidic environments. Recent work by Colman et al. (2018) suggests that thermoacidophilic archaea and the acidity of their habitats co-evolved after the evolution of oxygenic photosynthesis (since oxygen is used as primary electron acceptor in the metabolisms), showing a significant example of niche engineering and geosphere-biosphere coevolution. All together, these findings suggest that pH can be metabolically controlled either at the intracellular or local level, as compared to temperature, radiation, salinity, and pressure.[1]
On the macro-scale level, pH can dominate as the main parameter affecting microbial community composition and abundances. Several studies demonstrate that pH affects microbial community diversity more than any other parameter tested (e.g., Lauber et al., 2009; Rousk et al., 2010; Xiong et al., 2012; Kuang et al., 2013; Zhalnina et al., 2014). For example, distinct microbial communities were observed with changes in pH (pHrange 1.9–4.1), in which the genus Ferrovum dominated at higher pH while the phyla Alphaproteobacteria, Gammaproteobacteria, Nitrospirae, and Euryarchaeota were present at lower pHs (Kuang et al., 2013). Similarly, bacterial community composition changed with increasing pH in alkaline sediments of a Tibetan plateau (pHrange 6.88–10.37) (Xiong et al., 2012). Changes in community composition are likely derived from the range in which microorganisms can survive (Fernández-Calviño and Bååth, 2010). Most cultured microbes live within a narrow pH range of three to four units (Rosso et al., 1995), although some exceptions occur [e.g., fungal isolates can grow over five to nine pH units (Wheeler et al., 1991; Nevarez et al., 2009)]. Moreover, it has been suggested that archaeal (Kuang et al., 2013) and fungal communities (Rousk et al., 2010) may be less affected by changes in pH compared to bacteria.[1]
References[edit]
- ^ a b c d e f g h i j k l m Merino, Nancy; Aronson, Heidi S.; Bojanova, Diana P.; Feyhl-Buska, Jayme; Wong, Michael L.; Zhang, Shu; Giovannelli, Donato (2019). "Living at the Extremes: Extremophiles and the Limits of Life in a Planetary Context". Frontiers in Microbiology. 10: 780. doi:10.3389/fmicb.2019.00780. PMC 6476344. PMID 31037068. Material was copied from this source, which is available under a Creative Commons Attribution 4.0 International License.
- ^ . doi:10.3390/microorganisms5020025.
{{cite journal}}: Cite journal requires|journal=(help); Missing or empty|title=(help)CS1 maint: unflagged free DOI (link) Material was copied from this source, which is available under a Creative Commons Attribution 4.0 International License.
Cyanobacteria biofilms and mats[edit]
Biofilms, biocrusts and cyanobacteria
Semi-arid regions[edit]

Biocrusts are important functional units in dryland ecosystems. Regarded as ecosystem engineers, cyanobacteria in biocrusts contribute several major physico-chemical and biological processes. However, the role of cyanobacteria in the process of loess formation has been underestimated. The role of cyanobacteria in loess formation has only recently been recognized and the possible biogenic nature of loessification is underestimated as compared to their eolian nature. Mineral weathering and mineral precipitation processes as well as mineral dust flux between litho- and atmosphere mediated by cyanobacteria and biocrusts require more attention due to their significant contribution to ecosystem properties.[1]
The role of cyanobacteria in loess formation has only recently been recognized and the possible biogenic nature of loessification is underestimated as compared to their eolian nature. Mineral weathering and mineral precipitation processes as well as mineral dust flux between litho- and atmosphere mediated by cyanobacteria and biocrusts require more attention due to their significant contribution to ecosystem properties.[1]
Throughout the world, drylands are the most often encountered biotopes of biocrusts (Makhalayane et al. 2015; West 1990), where they can cover up to 70% of the surface (Buis et al. 2009; Karnieli et al. 2002). Biocrusts are present on all seven continents and in all climatic regions (Belnap and Lange 2003). They are particularly significant in the ecology of arid and semi-arid regions (Belnap 2006; Chamizo et al. 2012; Kidron et al. 2010). Biocrusts represent associations of sediment/soil particles with bacteria, cyanobacteria, algae, fungi, lichens and mosses (Belnap and Lange 2003; Chamizo et al. 2012; Evans and Johansen 1999; Hu et al. 2002a) and their secreted metabolites (primarily exopolysaccharides) (Lan et al. 2012), as well as microfauna (Pócs et al. 2006). As a highly productive microenvironment, biocrusts establish and control basic physico-chemical processes of the ground surface, influencing environmental properties at micro and macro scales. Biocrusts also influence soil development, hydrological processes, water and energy balance, nutrient content, soil temperature, movement of gases, eolian particle (dust) uptake and deposition and eventually, plant community development (Weber et al. 2016).[1]
Biocrust diversity is characterized by spatial and temporal variability (Williams et al. 2013), resulting in a succession of autochthonous life forms, with cyanobacteria being common components (Belnap 2001; Lan et al. 2013). The abundance of cyanobacteria in biocrusts of arid and semi-arid regions distributed around the world is significant (Colesie et al. 2016, Fig. 9.4). The cyanobacteria observed in biocrusts belong to at least 48 genera, of which 8 genera are present in all investigated regions (Colorado, Southeastern Utah, Northwestern Ohio, Mexico, India, Southern Africa, Israel, Iran and Spain).[1]
Xerotolerance is one of the major ecophysiological adaptations shaping microbial communities in arid and semi-arid conditions. Cyanobacteria tend to dominate microbial populations in desert biocrusts (Makhalayane et al. 2015; Potts 1994), reflecting their successful survival strategies against desiccation, the ability to cope with transient changes between hot/dry and warm/humid conditions, and versus exposure to high irradiance by visible and UV light (Whitelam and Codd 1986). Cyanobacteria can function as primary colonizers via their ability to grow photoautotrophically and the capacity of some members to fix atmospheric nitrogen. Surface colonization can be further enabled by the production of exopolymeric substances (EPS) leading to biofilm formation or to complex, multilayered microbial mats. Cyanobacterial EPS contains sulphate groups and uronic acids, which give the EPS an anionic and sticky character (Rossi and De Philippis 2015). The EPS layer also minimizes water loss and reduces UV irradiation reaching the cells, thus protecting against abiotic stress factors. Microalgae and mosses are generally unable to function as primary colonizers of constrained environments themselves, and depend on cyanobacteria to provide stable hydrated microenvironments with necessary nutrients (Zhang et al. 2015). In addition, cyanobacteria possess extensive metabolic responses that help them to cope with fluctuations in moisture and irradiance, and to pass through active-dormant-active transitions. Efficient protection of macromolecules constitutes one survival strategy of extremophilic and extremotolerant cyanobacteria. Protein denaturation in water-deficient cells is prevented by the accumulation of osmolytes including, intracellular sucrose and trehalose in drought-resistant cyanobacteria (Hershkovitz et al. 1991). Further defense mechanisms are used against reactive oxygen species (ROS) which cause damage to membranes, nucleic acids and proteins (Whitelem and Codd 1986; Billi and Potts 2002). ROS generation is accelerated under typical dehydrating conditions, i.e. strong sunlight/UV irradiation. Damage by ROS is partly controlled by cyanobacterial Fe-superoxide dismutase that neutralizes formed superoxide radicals (Shirkey et al. 2000). To prevent ROS generation by UV, cyanobacteria synthesize UV-absorbing scytonemin (Garcia-Pichel and Castenholz 1991) and mycosporine-like amino acids (MAAs) (Cockell and Knowland 1999; Garcia-Pichel and Castenholz 1993; Rastogi et al. 2014).[1]
The role of biocrust cyanobacteria in sediment particle accumulation and preservation of land surfaces has long been recognized (Belnap and Gardner 1993). The BLOCDUST hypothesis (Biological LOess Crust – DUSt Trapping) (Svirčev et al. 2013) postulates the role of cyanobacterial biocrusts in the process of loess formation. According to this hypothesis, the accumulation/growth of loess sediment in arid and semi-arid regions is supported via the trapping and accumulation of airborne dust particles during wet events by sticky cyanobacterial EPS. Intervening dry periods provide conditions for the preservation of particles captured and covered by firm biocrusts.[1]
Loess and related deposits are one of the most widespread Quaternary aeolian sedimentary formations, most abundant in semi-arid regions of inner Eurasia (Muhs 2013; Smalley et al. 2011). They present and preserve parent material for the synsedimentary formation of soils, such as fertile chernozem. Moreover, loess has a more applied role and presents a widespread building ground with specific geotechnical properties (Sprafke and Obreht 2016). Despite its importance, the processes required for loess formation are still not fully understood (Sprafke and Obreht 2016). Loess is usually defined as eolian sediments formed by the accumulation of wind-blown dust particles. However, this definition does not cover post-depositional processes related to the formation of loess structure. Typically, loess sediments have homogenous and highly porous structures, with particles loosely cemented by microcrystalline calcium carbonate derived from corrosion and re-precipitation of detrital carbonates (Muhs 2007; Muhs and Bettis 2003; Pésci 1990; Smalley et al. 2006). The formation of a typical loess structure is usually attributed to a process called loessification. Unfortunately, this process is still poorly understood because it is related to processes similar to pedogenesis (neo-formation of clays and Fe-oxides, and carbonate re-precipitation) and diagenesis (cementation of the particles and stabilization of sediment structure), placing loessification in between those processes (Pécsi 1990, 1995; Sprafke and Obreht 2016). In addition, the mechanisms of particle entrapment during dust accumulation are not fully understood. The role of cyanobacteria within biocrusts and processes related to their activity, however, have the potential to explain the processes of particle entrapment, accumulation and preservation. Here, we propose processes facilitated by cyanobacteria and their relation to loess formation. Besides construing the bio-geological importance of cyanobacteria and biocrusts, this article proposes distinct definitions of some ambiguous key terms and introduces a new term: “synergosis”. Further, the possible health significance of dust particle accumulation and of toxins potentially produced by biocrust cyanobacteria is also discussed.[1]
Biological loess crusts and cyanobacteria[edit]
There is a lack of clear definitions in the terminology of biological crusts. According to some definitions, biocrusts are characterized by periodical or permanent surface features influenced by factors including soil structure and type, irradiance, topographic attributes (Belnap 1995; Hu and Liu 2003; Lange et al. 1997; Zaady et al. 2000), mineral resources and water (Pickett and McDonnell 1989). We refer to a biocrust as a hardened, crisp structure formed by drying, consisting of living but dormant, highly specialized organisms in close association with sediment/soil particles. In describing the changes in biocrust physical properties, some language problems can lead to the use of terms that are redundant (pleonasms) or even contradictory. It can be easily observed that environmental changes between dry and wet events readily lead to a shift between the desiccated and hydrated appearance of biocrusts. In this context “dry biocrust”, the term commonly used in the literature, is pleonastic and “wet biocrust” is contradictory.[1]
When a biocrust becomes hydrated and active due to wetting, it can act as a biological terrestrial mat, a fully functional biological community. The early-developmental stages of hydrated biocrusts (Zhang 2005) improve the surface microenvironment, which in turn provides further aid to colonization and supports the survival of later successional stages (Acea et al. 2003; Hu and Liu 2003; Kurina and Vitousek 1999; Langhans et al. 2010; Lukešová 2001). By synthesizing significant amounts of EPSs, cyanobacteria can promote further growth of the microcommunity and may enable protozoa, small invertebrates and microfungi to become established. Biological terrestrial mat development continues until a climax community is established under given environmental conditions. Further successional steps may lead to the formation of vegetation (if the wet period continues) or the community may reverse to the crust stage (if dry conditions return).[1]
So far, biocrusts have been referred to by multiple names (cryptogamic, microbiotic, cryptobiotic and microphytic crusts) indicating some common features of the constituent organisms, but the most often-used term is “biological soil crust” (BSC) (Belnap et al. 2003a; Langhans et al. 2009). Many factors can be used to classify BSCs (Belnap 2003a; Berkeley et al. 2005; Dougill and Thomas 2004; Langhans et al. 2009; Pócs 2009) but especially important are the physicochemical properties of the growth surface (Chamizo et al. 2012). Regarding this factor, the question arises as to whether the term biological soil crusts can be used for all biocrusts. Declaring all biocrusts as soil crusts can lead to misunderstandings in both a scientific and etiological sense. Crust types differ from physical crusts to biocrusts, where different biological crust types can be described and called by specific names: biocrusts formed on soil, loess, sand, rocks and other substrates, differing in physical and chemical properties.[1]
While substrates, such as unconsolidated sediments (e.g. sand), and sedimentary, metamorphic or magmatic rocks are provided with a clear definition of their structure and genesis, this is not the case with the loess substrate. The specificity of loess lies in its polygenetic nature (Sprafke and Obreht 2016), determined by complex environmental sedimentary and post-depositional processes (Svirčev et al. 2013). While the process of loess formation remains to be fully understood and defined, it is certain that quasi-pedogenic and quasi-diagenetic processes have determined its present structure (Smalley and Marković 2014). Due to its high specificity, loess cannot be regarded either as a weakly consolidated sediment, soil, or rock, but as a distinct entity (Sprafke and Obreht 2016). For example, dust deposited to marine or lacustrine sediments is not loess because of the absence of the loessification process.[1]
Photosynthetic efficiency of cyanobacteria in coastal microbial mats[edit]

Microbial mats are diverse and stratified microbial biofilm communities characterized by steep gradients in light, temperature and chemical parameters. Their high optical density creates a competition for light among phototrophic microalgae and bacteria residing in the uppermost mat layers. Strategies to counter such resource limitation include metabolic investment in protective and light-harvesting pigments enabling exploitation of separate niches in terms of irradiance and spectral composition, or investment in motility to enable migration to an optimal light microenvironment.[3]
Light-exposed coastal sediments in shallow waters and intertidal areas are often colonized by benthic microalgae and cyanobacteria, which under the absence of animal grazing (typically under environmental extremes such as desiccation, high salinity or sulfide levels) can form complex stratified microbial biofilm communities, i.e., microbial mats (Stal, 1995), that stabilize the sediment by excretion of exopolymers. Microbial mats are densely populated and highly compacted, vertically stratified microbial communities characterized by steep gradients of physical (light and temperature) and chemical parameters (Kühl et al., 1996; Dillon et al., 2009; Al-Najjar et al., 2012; De Beer and Stoodley, 2013). The uppermost layers of coastal microbial mat layers are typically dominated by diatoms on top of a dense green cyanobacterial layer that is often dominated by Microcoleus chtonoplastes and various other motile, filamentous cyanobacteria (Wieland et al., 2003; Fourcans et al., 2004; Dillon et al., 2009). Often, purple sulfur bacteria and green filamentous anoxygenic phototrophs are found below the cyanobacteria followed by a reduced black layer of precipitated iron sulfide (Jørgensen, 1982). Besides light-driven sulfide oxidation by anoxygenic phototrophs, sulfide can also be oxidized efficiently by colorless sulfur bacteria such as filamentous Beggiatoa spp. (Nelson and Castenholz, 1981) that are motile and produce white patches in the microbial mat at the oxygen-sulfide interface (Jørgensen and Revsbech, 1983).[3]
Light is the primary energy source for photosynthetic microbial mats. Due to the high density of photopigments, organic matter, and sediment particles, light is subject to intense scattering and absorption within microbial mats (Kühl and Jørgensen, 1994; Kühl et al., 1994). This can lead to an extremely narrow photic zone (Kühl et al., 1997) and a rapid change in spectral composition with depth (Lassen et al., 1992; Cartaxana et al., 2016b). Ploug et al. (1993) related changes in light quality in a coastal microbial mat to the vertical zonation of a population of diatoms over a dense filamentous cyanobacteria layer that largely sustained their oxygenic photosynthesis via phycobiliproteins with absorption characteristics complementary to chlorophylls. Similarly, complementary use of visible and near-infrared radiation by chlorophylls/phycobilins vs. bacteriochlorophylls enables coexistence of dense populations of oxygenic phototrophs on top of anoxygenic phototrophs (Kühl and Fenchel, 2000). Apart from light, other parameters such as nutrient availability or the presence of sulfide may vertically limit photosynthesis in microbial mats (Stal, 1995; Kühl et al., 1996; Wieland et al., 2003).[3]
The ecological success of benthic microbes in optically dense and vertically stratified communities has recurrently been linked to cell motility allowing individual microbes to search for optimal environmental conditions regarding crucial parameters such as light, temperature, O2 or nutrient availability (Whale and Walsby, 1984; Bebout and Garcia-Pichel, 1995; Bhaya, 2004; Serôdio et al., 2006). Complex migratory rhythms determined by day/night cycles, tidal regimes, UV exposure and changes in irradiance levels have been described for both diatom- and cyanobacteria-dominated phototrophic mat communities (Bebout and Garcia-Pichel, 1995; Serôdio et al., 2006; Coelho et al., 2011). Similar strategies to optimize photon capture are known in terrestrial plants, where the position of chloroplast in palisade and mesophyll layers in leaves can change depending on light levels and light field directionality, i.e., diffuse versus collimated light (Vogelmann, 1993; Gorton et al., 1999; Wada et al., 2003). Raphidic diatoms, filamentous cyanobacteria and Beggiatoa spp. are able to glide within an extracellular polymeric matrix at speeds of 0–10 μm s–1 (Glagoleva et al., 1980; Richardson and Castenholz, 1987; Hoiczyk, 2000; Gupta and Agrawal, 2007; Kamp et al., 2008; Tamulonis et al., 2011). Because of the steep light gradient, migration and the resultant vertical redistribution of the productive biomass have important consequences for both the photobiology of the phototrophs and the net primary productivity of the microbial mat ecosystem (Bebout and Garcia-Pichel, 1995; Cartaxana et al., 2016b).[3]
Bacterial adhesion to a surface[edit]

Bacterial adhesion is governed by diverse surface properties
including surface charge density, wettability, roughness, topography, and stiffness.
Biofilms are structured microbial communities attached to surfaces, which play a significant role in the persistence of biofoulings in both medical and industrial settings. Bacteria in biofilms are mostly embedded in a complex matrix comprised of extracellular polymeric substances that provide mechanical stability and protection against environmental adversities. Once the biofilm is matured, it becomes extremely difficult to kill bacteria or mechanically remove biofilms from solid surfaces. Therefore, interrupting the bacterial surface sensing mechanism and subsequent initial binding process of bacteria to surfaces is essential to effectively prevent biofilm-associated problems.[5]
Biofilm is a three-dimensional structure formed as a result of microorganism’s surface sensing, initial adhesion to surfaces, followed by subsequent colonization and production of an extracellular polysaccharides matrix (EPS) (Flemming et al., 2016). The development of the biofilm is a sequential process that starts with a loose association of the microorganisms to a surface then converted to strong adhesion. At the final stage of adhesion, the bacterial cell wall is deformed, which reinforces the bacteria’s adhesion toward the surface by positioning the cytoplasmic bacterial molecules closer to the surface. This enables bacteria to interact with surfaces using their bacterial surface molecules in the form of Lifshitz-van der Waals attractive forces (Carniello et al., 2018). Once the microorganisms adhere to a surface, they often aggregate and form microcolonies that maturate over time (An and Friedman, 1998). The structured channels within the biofilm facilitate the exchanges of nutrients and byproducts between the embedded microorganisms and the external environment, which attributes to the microorganisms’ colonization growth and maturation (Flemming et al., 2016). After biofilm maturation, the microorganisms shed and move from the matured biofilm to join another biofilm community or to become a pioneer of a new one (Hall-Stoodley et al., 2004).[5]
A significant feature of the biofilm is that it can form either on a biotic or abiotic surface. Thus, it is deeply associated with a diverse spectrum of industrial biofouling as well as human health problems, such as dental caries, infective endocarditis, cystic fibrosis pneumonia, and peritoneal dialysis catheters infection (Hall-Stoodley et al., 2004). Particularly, 60–70% of all healthcare-associated infections are attributed to biofilm infections in implantable medical devices (Bryers, 2008), thereby it is imperative to develop novel anti-infectious biomaterials. Biofilm formation is essential for microorganisms’ survival since it benefits bacteria; it stimulates bacterial growth and acts as a barrier that protects the embedded microorganisms from environmental challenges and administered antimicrobials (Lebeaux et al., 2014). During the biofilm maturation, the EPS matrix enhances cell adhesion and cohesion that promote both microbial accumulation onto a surface and the development of densely packed cell aggregates, resulting in a highly structured and adherent biofilm. As such, once biofilms are established, it becomes extremely difficult to kill embedded bacteria or mechanically remove biofilms from surfaces. Therefore, interrupting the bacterial surface sensing mechanism and their initial binding process to surfaces is essential to effectively prevent biofilm-related problems.[5]
Highlighting that biofilm formation is initiated by bacterial adhesion to a surface, bacterial sensing and responding to surfaces have been widely studied. There are many factors affecting the process of bacterial adhesion to a surface; duration of exposure of bacteria to surfaces, population of inoculated bacteria, bacterial characteristics (e.g., cell wall components, appendages, and motility), and type/richness of nutrients could affect. Surface properties of the substrate, such as surface charge density, wettability, roughness, stiffness, and surface topography are also considered important factors governing initial bacterial adhesion to surfaces (as illustrated in Figure 1) (An and Friedman, 1998; Song et al., 2015; Carniello et al., 2018; Li et al., 2019; Chien et al., 2020). From that aspect, there were many attempts to explain the mechanism of bacterial binding to surfaces using physicochemical approaches such as thermodynamic theory, Lifshitz-van der Waals, and electrostatic-double layer interactions (Carniello et al., 2018). On the other hand, various strategies have been developed to prevent biofilm formation at an early stage, either by engineering anti-adhesive surface properties or introducing antibacterial elements to a surface (Zhang et al., 2018; Chi et al., 2019; Li et al., 2019).[5]
References[edit]
- ^ a b c d e f g h i j k l m . doi:10.1007/s11104-019-04048-3.
{{cite journal}}: Cite journal requires|journal=(help); Missing or empty|title=(help) Material was copied from this source, which is available under a Creative Commons Attribution 4.0 International License.
- ^ . doi:10.1016/j.quaint.2012.10.048.
{{cite journal}}: Cite journal requires|journal=(help); Missing or empty|title=(help) - ^ a b c d e f . doi:10.3389/fmars.2020.00359.
{{cite journal}}: Cite journal requires|journal=(help); Missing or empty|title=(help)CS1 maint: unflagged free DOI (link) Material was copied from this source, which is available under a Creative Commons Attribution 4.0 International License.
- ^ . doi:10.1038/ismej.2007.50.
{{cite journal}}: Cite journal requires|journal=(help); Missing or empty|title=(help) - ^ a b c d e . doi:10.3389/fbioe.2021.643722.
{{cite journal}}: Cite journal requires|journal=(help); Missing or empty|title=(help)CS1 maint: unflagged free DOI (link) Material was copied from this source, which is available under a Creative Commons Attribution 4.0 International License.
Microbial and microbot movement[edit]
| Part of a series on |
| Microbial and microbot movement |
|---|
 |