User:Ziemniak12/sandbox

From Wikipedia, the free encyclopedia
Bob I
King of the United Kingdom and the British Dominions
Reign10:06 10 July 1968 –
18:06 10 July 1968
PredecessorElizabeth II
SuccessorScarlet I
Prime MinistersSee list
Bornc. 3.5 billion BC
Primordial Ooze
SpouseNone
Names
Bob the Minion
HouseHouse of Minion
FatherUnknown
MotherUnknown
ReligionAnglican
SignatureBob I's signature
United States presidential election, 2012

← 2008 November 6, 2012 2016 →

538 electoral votes of the Electoral College
270 electoral votes needed to win
Turnout61.1% (voting eligible)[1]
 
Nominee Tom Selleck Barack Obama
Party Republican Democratic
Home state California Illinois
Running mate Marco Rubio Joe Biden
Electoral vote 272 266
States carried 29 21 + DC
Popular vote 67,407,717 65,915,796
Percentage 49.7% 48.6%

2012 United States presidential election in California2012 United States presidential election in Oregon2012 United States presidential election in Washington (state)2012 United States presidential election in Idaho2012 United States presidential election in Nevada2012 United States presidential election in Utah2012 United States presidential election in Arizona2012 United States presidential election in Montana2012 United States presidential election in Wyoming2012 United States presidential election in Colorado2012 United States presidential election in New Mexico2012 United States presidential election in North Dakota2012 United States presidential election in South Dakota2012 United States presidential election in Nebraska2012 United States presidential election in Kansas2012 United States presidential election in Oklahoma2012 United States presidential election in Texas2012 United States presidential election in Minnesota2012 United States presidential election in Iowa2012 United States presidential election in Missouri2012 United States presidential election in Arkansas2012 United States presidential election in Louisiana2012 United States presidential election in Wisconsin2012 United States presidential election in Illinois2012 United States presidential election in Michigan2012 United States presidential election in Indiana2012 United States presidential election in Ohio2012 United States presidential election in Kentucky2012 United States presidential election in Tennessee2012 United States presidential election in Mississippi2012 United States presidential election in Alabama2012 United States presidential election in Georgia2012 United States presidential election in Florida2012 United States presidential election in South Carolina2012 United States presidential election in North Carolina2012 United States presidential election in Virginia2012 United States presidential election in West Virginia2012 United States presidential election in the District of Columbia2012 United States presidential election in Maryland2012 United States presidential election in Delaware2012 United States presidential election in Pennsylvania2012 United States presidential election in New Jersey2012 United States presidential election in New York2012 United States presidential election in Connecticut2012 United States presidential election in Rhode Island2012 United States presidential election in Vermont2012 United States presidential election in New Hampshire2012 United States presidential election in Maine2012 United States presidential election in Massachusetts2012 United States presidential election in Hawaii2012 United States presidential election in Alaska2012 United States presidential election in the District of Columbia2012 United States presidential election in Maryland2012 United States presidential election in Delaware2012 United States presidential election in New Jersey2012 United States presidential election in Connecticut2012 United States presidential election in Rhode Island2012 United States presidential election in Massachusetts2012 United States presidential election in Vermont2012 United States presidential election in New Hampshire
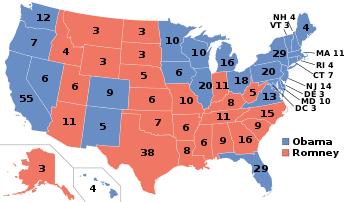
Presidential election results map. Blue denotes states/districts won by Obama/Biden. Red denotes those won by Romney/Ryan. Numbers indicate electoral votes allotted to the winner of each state.

President before election

Barack Obama
Democratic

Elected President

Tom Selleck
Republican

United States presidential election, 2008

← 2004 November 4, 2008 2012 →

All 538 electoral votes of the Electoral College
270 electoral votes needed to win
Turnout61.6% (voting eligible)[2]
 
Nominee Barack Obama John McCain
Party Democratic Republican
Home state Illinois Arizona
Running mate Joe Biden Tom Selleck
Electoral vote 353 185
States carried 27 + DC 23
Popular vote 68,841,630 60,604,213
Percentage 52.4% 46.2%

2008 United States presidential election in California2008 United States presidential election in Oregon2008 United States presidential election in Washington (state)2008 United States presidential election in Idaho2008 United States presidential election in Nevada2008 United States presidential election in Utah2008 United States presidential election in Arizona2008 United States presidential election in Montana2008 United States presidential election in Wyoming2008 United States presidential election in Colorado2008 United States presidential election in New Mexico2008 United States presidential election in North Dakota2008 United States presidential election in South Dakota2008 United States presidential election in Nebraska2008 United States presidential election in Kansas2008 United States presidential election in Oklahoma2008 United States presidential election in Texas2008 United States presidential election in Minnesota2008 United States presidential election in Iowa2008 United States presidential election in Missouri2008 United States presidential election in Arkansas2008 United States presidential election in Louisiana2008 United States presidential election in Wisconsin2008 United States presidential election in Illinois2008 United States presidential election in Michigan2008 United States presidential election in Indiana2008 United States presidential election in Ohio2008 United States presidential election in Kentucky2008 United States presidential election in Tennessee2008 United States presidential election in Mississippi2008 United States presidential election in Alabama2008 United States presidential election in Georgia2008 United States presidential election in Florida2008 United States presidential election in South Carolina2008 United States presidential election in North Carolina2008 United States presidential election in Virginia2008 United States presidential election in West Virginia2008 United States presidential election in the District of Columbia2008 United States presidential election in Maryland2008 United States presidential election in Delaware2008 United States presidential election in Pennsylvania2008 United States presidential election in New Jersey2008 United States presidential election in New York2008 United States presidential election in Connecticut2008 United States presidential election in Rhode Island2008 United States presidential election in Vermont2008 United States presidential election in New Hampshire2008 United States presidential election in Maine2008 United States presidential election in Massachusetts2008 United States presidential election in Hawaii2008 United States presidential election in Alaska2008 United States presidential election in the District of Columbia2008 United States presidential election in Maryland2008 United States presidential election in Delaware2008 United States presidential election in New Jersey2008 United States presidential election in Connecticut2008 United States presidential election in Rhode Island2008 United States presidential election in Massachusetts2008 United States presidential election in Vermont2008 United States presidential election in New Hampshire
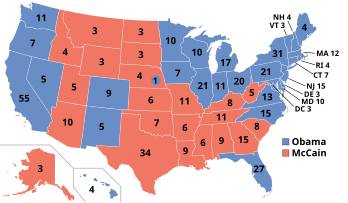
Presidential election results map. Blue denotes states/districts won by Obama/Biden, and Red denotes those won by McCain/Palin. Numbers indicate electoral votes allotted to the winner of each state. Obama won one electoral vote (from Nebraska's 2nd congressional district) of Nebraska's five.

President before election

George W. Bush
Republican

Elected President

Barack Obama
Democratic

Republican presidential primaries, 2008

← 2004 January 3 to June 3, 2008 2012 →
 
Nominee John McCain Tom Selleck Mike Huckabee
Party Republican Republican Republican
Home state Arizona California Arkansas
States carried 31+DC+PR+GU+AS+MP+VI 8 9
Popular vote 7,922,238[3] 4,446,494 4,276,046
Percentage 37.86% 21.25% 20.43%

 
Nominee Mitt Romney Ron Paul
Party Republican Republican
Home state Massachusetts Texas
States carried 2 0
Popular vote 2,349,894 1,044,363
Percentage 11.23% 4.99%

Republican primary/caucus wins: John McCain; Mitt Romney; Mike Huckabee

President before election

George W. Bush

Republican nominee

John McCain

California gubernatorial election, 2006

← 2003 November 7, 2006 2010 →
 
Nominee Tom Selleck Phil Angelides
Party Republican Democratic
Popular vote 4,994,115 3,289,949
Percentage 57.54% 37.91%

Governor before election

Tom Selleck
Republican

Elected Governor

Tom Selleck
Republican

California gubernatorial recall election, 2003

← 2002 October 7, 2003 2006 →
 
Candidate Tom Selleck Cruz Bustamante Tom McClintock
Party Republican Democratic Republican
Popular vote 4,033,151 2,984,386 1,074,624
Percentage 46.6% 34.5% 12.4%

Governor before election

Gray Davis
Democratic

Elected Governor

Tom Selleck
Republican

David E. Hayek federal election, June 2015
← May 2015 3 June 2015 (2015-06-03) Next →

All 100 seats in the Anatomical Assembly
51 seats needed for a majority
Opinion polls
  First party Second party Third party
  Brain Other Heart
Leader Brain Penis Heart
Party Rational Thought Party Lust Party Emotional Party
Leader's seat Cranium Crotch Left Chest Cavity
Last election 52 seats, 35.9% 22 seats, 23.8% 20 seats, 25.5%
Seats before 50 23 20
Seats won 47 24 21
Seat change Decrease 3 Increase 1 Increase 1
Popular vote 12.5 trillion 9.3 trillion 9.2 trillion
Percentage 35.9% 25.1% 24.9%
Swing Increase 1.8% Increase 1.3% Decrease 0.6%

  Fourth party Fifth party Sixth party
  Stomach Tooth Tooth
Leader Stomach Upper Left First Molar Lower Right First Molar
Party Hunger Party Oral Health Party Dental Hygiene Party
Leader's seat Lower Torso Upper Jaw Lower Jaw (defeated)
Last election 4 seats, 11.9% new party 2 seats, 2.9%
Seats before 5 0 2
Seats won 5 2 1
Seat change 0 Increase 2 Decrease 1
Popular vote 4.9 trillion 0.6 trillion 0.5 trillion
Percentage 13.2% 1.6% 1.4%
Swing Increase 1.3% Increase 1.6% Decrease 1.5%

Prime Minister of David E. Hayek before election

Brain
Rational Thought Party

Subsequent Prime Minister

Brain
Rational Thought Party

  1. ^ McDonald, Michael (March 25, 2013). "2012 General Election Turnout Rates". George Mason University. Retrieved April 12, 2013.
  2. ^ "2008 General Election Turnout Rates". George Mason University. 2012. Retrieved October 29, 2012.
  3. ^ "2008 Republican Popular Vote".